Unlock a world of possibilities! Login now and discover the exclusive benefits awaiting you.
- Qlik Community
- :
- All Forums
- :
- QlikView App Dev
- :
- Heat map fixed color irrespective of values on X a...
Options
- Subscribe to RSS Feed
- Mark Topic as New
- Mark Topic as Read
- Float this Topic for Current User
- Bookmark
- Subscribe
- Mute
- Printer Friendly Page
Turn on suggestions
Auto-suggest helps you quickly narrow down your search results by suggesting possible matches as you type.
Showing results for
Not applicable
2017-03-04
12:41 PM
- Mark as New
- Bookmark
- Subscribe
- Mute
- Subscribe to RSS Feed
- Permalink
- Report Inappropriate Content
Heat map fixed color irrespective of values on X and Y axis
Hi,
I have a requirement to create a model, where the range of color changes from one cell to another irrespective of values on the x and y axis.
I want to create an analysis for courses taken by students and the age range for them. So my chart should look something like below:
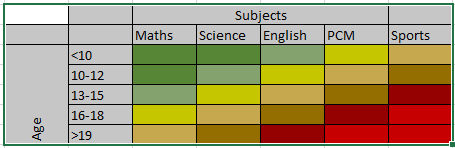
I have tried using Pivot Table and the colormix formula, to set the background color using the below logic:
=ColorMix2((sum(Z)),ARGB(255, 197, 0, 23), ARGB(255, 128, 166, 47), ARGB(255, 247, 150, 70))
But as you see, this considers the value and assigns color, where as i want my colors to be fixed irrespective of values. Is there a way i can achieve this in Qlik.
613 Views
0 Replies