Unlock a world of possibilities! Login now and discover the exclusive benefits awaiting you.
- Qlik Community
- :
- All Forums
- :
- QlikView App Dev
- :
- Help me in displaying latest 10 values in barchart...
- Subscribe to RSS Feed
- Mark Topic as New
- Mark Topic as Read
- Float this Topic for Current User
- Bookmark
- Subscribe
- Mute
- Printer Friendly Page
- Mark as New
- Bookmark
- Subscribe
- Mute
- Subscribe to RSS Feed
- Permalink
- Report Inappropriate Content
Help me in displaying latest 10 values in barchart.
Hi All,
Please help me in displaying the latest 10 values in bar chart. please find the sample attachment application and detail description in it
This is higly appreciable. please help me to resolve this.
Thanks,
Durga
- Tags:
- app development
- « Previous Replies
- Next Replies »
- Mark as New
- Bookmark
- Subscribe
- Mute
- Subscribe to RSS Feed
- Permalink
- Report Inappropriate Content
- Mark as New
- Bookmark
- Subscribe
- Mute
- Subscribe to RSS Feed
- Permalink
- Report Inappropriate Content
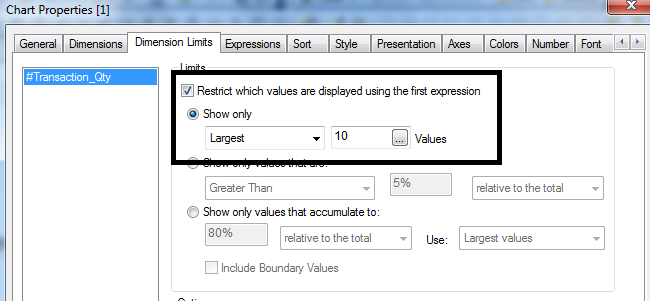
use Dimension Limit
- Mark as New
- Bookmark
- Subscribe
- Mute
- Subscribe to RSS Feed
- Permalink
- Report Inappropriate Content
Hi,
you can try the below expression...
=if(GetCurrentField(Date)='DATE',
Count(DISTINCT {<DATE={'>=$(=MAX(DATE,10))'}>}(Customer) & ([Trigger ID])),
Count(DISTINCT {<DATE={'>=$(=Date(max(DATE)-28))'}>}(Customer) & ([Trigger ID])))
- Mark as New
- Bookmark
- Subscribe
- Mute
- Subscribe to RSS Feed
- Permalink
- Report Inappropriate Content
As, i am unable to implement it in my application. if possible please do it.
Jsingh. i tried that is not working. it is giving result with missing dates.
- Mark as New
- Bookmark
- Subscribe
- Mute
- Subscribe to RSS Feed
- Permalink
- Report Inappropriate Content
HI,
Please find the attached application,
please check your month and Week calculations once
- Mark as New
- Bookmark
- Subscribe
- Mute
- Subscribe to RSS Feed
- Permalink
- Report Inappropriate Content
Hi Settu,
It is not displaying any data in bar chart if i used that expression. can you have a look at my application to try the result.
thanks,
- Mark as New
- Bookmark
- Subscribe
- Mute
- Subscribe to RSS Feed
- Permalink
- Report Inappropriate Content
Hi Sashikanth,
It is not giving appropriate results. it is showing first values.
my expected output needs to display the latest/recent dates i.e from 12/6/2015 to 3/4/2015 (right to left of barchart).
Please check and advice me.
thanks
- Mark as New
- Bookmark
- Subscribe
- Mute
- Subscribe to RSS Feed
- Permalink
- Report Inappropriate Content
HI ,
please find attached
- Mark as New
- Bookmark
- Subscribe
- Mute
- Subscribe to RSS Feed
- Permalink
- Report Inappropriate Content
Great sasi, it gave idea. But Couple of changes required to apply on that applcation.
1. dates need to display from 3/4/2015 to 12/6/2015.
2. Drill down needs to be cyclic drill down and when i click on cyclic drill down button it needs to go for week and needs to display four/five weeks in that month.
please advice this is very important to my dashboard.
Thanks,
Durga
- « Previous Replies
- Next Replies »