Unlock a world of possibilities! Login now and discover the exclusive benefits awaiting you.
- Qlik Community
- :
- All Forums
- :
- QlikView App Dev
- :
- Help with forming expression
- Subscribe to RSS Feed
- Mark Topic as New
- Mark Topic as Read
- Float this Topic for Current User
- Bookmark
- Subscribe
- Mute
- Printer Friendly Page
- Mark as New
- Bookmark
- Subscribe
- Mute
- Subscribe to RSS Feed
- Permalink
- Report Inappropriate Content
Help with forming expression
Hi all,
I need to write an expression and need help. The data is as shown below:
| Company | Participant | Question | Answer | |
|---|---|---|---|---|
| C1 | John | A | 5 | |
| C1 | John | B | 6 | |
| C1 | Jack | A | 3 | |
| C1 | Jack | B | 3 | |
| C1 | James | A | 6 | |
| C1 | James | B | 4 | |
| C1 | Jim | A | 4 | |
| C1 | Jim | B | 5 | |
| C2 | Andy | A | 5 | |
| C2 | Andy | B | 2 | |
| C2 | Bill | A | 3 | |
| C2 | Bill | B | 4 |
There are two questions A and B. Each participant answers both questions on a scale of 1-6.This example has just two companies.
Requirement:
When I choose a company I firstly have to determine the average for question A -
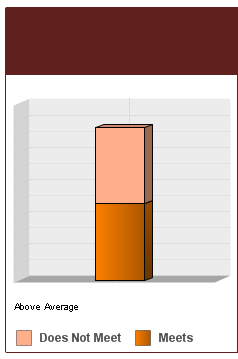
Get list of all participants who answered above the company average.From this population, find out their answers for question B and then finally decide if their answer to question B was above or below the company average for question A and label them meets and does not meet expectations. If we use company C1 as example average for question A would be (5+3+6+4)/4 = 4.5 . John and James answered more than company average for question A. Get their answers for question B - John answered 6, James answered 4. Therefore John met expectations (6>4.5) and James did not meet expectations(4<4.5). We need to calculate the total percentage for meets and did not meet and display them as bar graphs( this case would be 50-50) . say If we had a third respondent who answered 5 to question A(>4.5) and 5 to question B(4.5), then meets would be 75% and does not meet would be 50%
I should be able to choose any company and see their corresponding results. Can someone please let me know how I need to get started?
Please let me know if I need to explain this in more detail.
Thanks,
Praveen
Accepted Solutions
- Mark as New
- Bookmark
- Subscribe
- Mute
- Subscribe to RSS Feed
- Permalink
- Report Inappropriate Content
Maybe like attached?
- Mark as New
- Bookmark
- Subscribe
- Mute
- Subscribe to RSS Feed
- Permalink
- Report Inappropriate Content
Maybe like attached?
- Mark as New
- Bookmark
- Subscribe
- Mute
- Subscribe to RSS Feed
- Permalink
- Report Inappropriate Content
Thank you