Unlock a world of possibilities! Login now and discover the exclusive benefits awaiting you.
- Qlik Community
- :
- All Forums
- :
- QlikView App Dev
- :
- Help with set analysis
- Subscribe to RSS Feed
- Mark Topic as New
- Mark Topic as Read
- Float this Topic for Current User
- Bookmark
- Subscribe
- Mute
- Printer Friendly Page
- Mark as New
- Bookmark
- Subscribe
- Mute
- Subscribe to RSS Feed
- Permalink
- Report Inappropriate Content
Help with set analysis
I have two variables
Currentday = 06/11/2012
Previousmonth = 05/12/2012.
I am trying to write a set expression in my line chart using these two variable where date lies between Currentday to Previous month
Date is the dimension
- « Previous Replies
-
- 1
- 2
- Next Replies »
- Mark as New
- Bookmark
- Subscribe
- Mute
- Subscribe to RSS Feed
- Permalink
- Report Inappropriate Content
Hi AJ,
Assuming the format returned by the variables and the field is the same, let's say DD/MM/YYYY, something like the following should do.
Sum({< Date = {'>=$(=Date(Currentday))<=$(=Date(Previousmonth))'} >} Sales)
Note the single quoting, the equals and that QlikView is case sensitive for variable names as well as field names.
Hope that helps.
Miguel
- Mark as New
- Bookmark
- Subscribe
- Mute
- Subscribe to RSS Feed
- Permalink
- Report Inappropriate Content
Miguel,
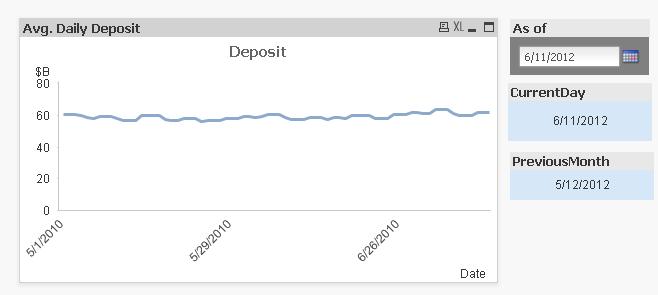
Avg({< Date = {'>=$(=Date(VarCurrentDay))<=$(=Date(VarPreviousMonth))'} >} Deposit)
Here what I am getting with above expression, do I have to adjust some settings
I have data(Dates) from May2010 to Aug2012
- Mark as New
- Bookmark
- Subscribe
- Mute
- Subscribe to RSS Feed
- Permalink
- Report Inappropriate Content
Hi,
It seems that the set analysis is not being evaluated correctly for some reason. Did you check that formats in both Date field and Date(VarCurrentDay) function return the same? Is the "As of" calendar object using a variable or a value from a field?
Miguel
- Mark as New
- Bookmark
- Subscribe
- Mute
- Subscribe to RSS Feed
- Permalink
- Report Inappropriate Content
Date and Date(VarCurrentDay) are in same format MM/DD/YYYY and
As of calendar object is using a variable VarCurrentDay with Min Value = Min(Date) and Max value= Max(Date)
- Mark as New
- Bookmark
- Subscribe
- Mute
- Subscribe to RSS Feed
- Permalink
- Report Inappropriate Content
Hi,
Then that should work. Check the application attached that addresses a very similar issue just in case.
Hope that helps.
Miguel
- Mark as New
- Bookmark
- Subscribe
- Mute
- Subscribe to RSS Feed
- Permalink
- Report Inappropriate Content
Miguel,
I want line chart to dynamically display between Current slected date from calendar object to 30 days prior to selected date
if user select 06/11/2012 then line chart should display from
05/10/2012 to 06/11/2012. But looks like example application you just sent is showing all dates same is happening with my application as I have date from May 2010 to Aug 2012.
- Mark as New
- Bookmark
- Subscribe
- Mute
- Subscribe to RSS Feed
- Permalink
- Report Inappropriate Content
may be This help Full for you
- Mark as New
- Bookmark
- Subscribe
- Mute
- Subscribe to RSS Feed
- Permalink
- Report Inappropriate Content
Hi,
I've just checked the application. It's working fine here, select for example 22/08/2012. Reload it again.
Miguel
- Mark as New
- Bookmark
- Subscribe
- Mute
- Subscribe to RSS Feed
- Permalink
- Report Inappropriate Content
Miguel,
Quick question why line chart is including 05/10/2012 31/10/2012 ?
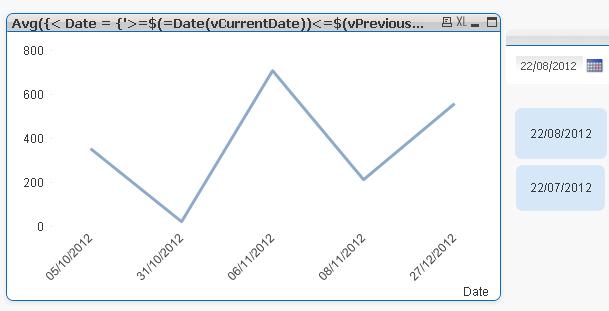
I just want line chart to to be displayed from 22/07/2012 to 22/08/2012
This is what I am having hard time understanding
- « Previous Replies
-
- 1
- 2
- Next Replies »