Unlock a world of possibilities! Login now and discover the exclusive benefits awaiting you.
- Qlik Community
- :
- All Forums
- :
- QlikView App Dev
- :
- Hide Text Object?
- Subscribe to RSS Feed
- Mark Topic as New
- Mark Topic as Read
- Float this Topic for Current User
- Bookmark
- Subscribe
- Mute
- Printer Friendly Page
- Mark as New
- Bookmark
- Subscribe
- Mute
- Subscribe to RSS Feed
- Permalink
- Report Inappropriate Content
Hide Text Object?
Hi All,
I am using 2 container. One container contain another container.
My requirement is when I select Sales (Bar Chart) then only text object will display other wise it will hide always.
How I achieve this???
Please find sample app in attachment.
Please help...
Accepted Solutions
- Mark as New
- Bookmark
- Subscribe
- Mute
- Subscribe to RSS Feed
- Permalink
- Report Inappropriate Content
Since Qlikview does not track the selection of a tab in a container (at least that is visible to user), we cannot show/hide based on a tab selection of a container. So what you are looking to do is not possible.
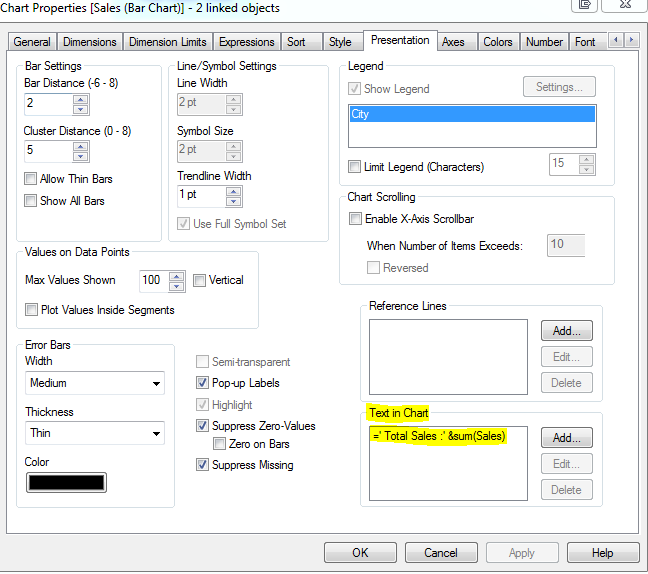
However! Instead of what you are doing, create "Text in Chart" and just copy and paste your formula. Then this will create sort of a textbox in your chart and you can move it around using Ctrl-Shift.
Please find attached.
Hoep this helps!
- Mark as New
- Bookmark
- Subscribe
- Mute
- Subscribe to RSS Feed
- Permalink
- Report Inappropriate Content
You'll need to take advantage of conditional shows. Have you tried that yet?
- Mark as New
- Bookmark
- Subscribe
- Mute
- Subscribe to RSS Feed
- Permalink
- Report Inappropriate Content
Since Qlikview does not track the selection of a tab in a container (at least that is visible to user), we cannot show/hide based on a tab selection of a container. So what you are looking to do is not possible.
However! Instead of what you are doing, create "Text in Chart" and just copy and paste your formula. Then this will create sort of a textbox in your chart and you can move it around using Ctrl-Shift.
Please find attached.
Hoep this helps!
- Mark as New
- Bookmark
- Subscribe
- Mute
- Subscribe to RSS Feed
- Permalink
- Report Inappropriate Content
Hi Jerem,
Thanks for your solution. This is working fine  .
.
Can you please tell me one more thing then I'll close this thread.
If I want to add more then one expression one beneath another then how to write?
I tried to add but second one is showing right side of the chart.
Please help...
- Mark as New
- Bookmark
- Subscribe
- Mute
- Subscribe to RSS Feed
- Permalink
- Report Inappropriate Content
Do you mean you are not sure how to move the text once you create it? As I mentioned above, you can use Ctrl-Shift, then little red boxes will appear (First you have to have the chart selected [Just click an arbitrary point on chart to select it]). From here, you can drag the text to where you want on the chart.
Hope this helps!
- Mark as New
- Bookmark
- Subscribe
- Mute
- Subscribe to RSS Feed
- Permalink
- Report Inappropriate Content
Hi.
You can press Ctrl+Shift to activate edit mode in the object so you can adjust the size and position of labels such as those text comments.
Regards
- Mark as New
- Bookmark
- Subscribe
- Mute
- Subscribe to RSS Feed
- Permalink
- Report Inappropriate Content
Thanks a lot jerem....