Unlock a world of possibilities! Login now and discover the exclusive benefits awaiting you.
- Qlik Community
- :
- All Forums
- :
- QlikView App Dev
- :
- Hiding lines in the chart or calculate ranks diffe...
- Subscribe to RSS Feed
- Mark Topic as New
- Mark Topic as Read
- Float this Topic for Current User
- Bookmark
- Subscribe
- Mute
- Printer Friendly Page
- Mark as New
- Bookmark
- Subscribe
- Mute
- Subscribe to RSS Feed
- Permalink
- Report Inappropriate Content
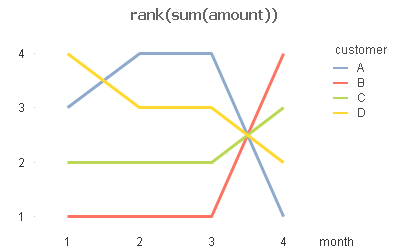
Hiding lines in the chart or calculate ranks differently
For a while already I am struggling with something apparently simple:
The chart below calculates and plots the ranks of all customer in the available set of data. The individual lines are all correct but I need a chart which shows only the line of a selected customer (because in real life it will be >180 customers).
When I add a listbox and select a customer I get a flat line because the selected customer always ranks 1st.
I see two options to solve it:
1. I hide all but the selected lines
2. I need to change my expression that has as output only the rank of the selected customer.
Can anybody please advise how I can proceed with either option 1 or 2 ?
- Mark as New
- Bookmark
- Subscribe
- Mute
- Subscribe to RSS Feed
- Permalink
- Report Inappropriate Content
Hi,
use the following statement in order to make lines in a graph invisible
set it in the <background> option of the expression
=if(selectiion criteria, ARGB(0,0,0,0))
Goodluck
F.