Unlock a world of possibilities! Login now and discover the exclusive benefits awaiting you.
- Qlik Community
- :
- All Forums
- :
- QlikView App Dev
- :
- Highlighting particular week or range of time in s...
- Subscribe to RSS Feed
- Mark Topic as New
- Mark Topic as Read
- Float this Topic for Current User
- Bookmark
- Subscribe
- Mute
- Printer Friendly Page
- Mark as New
- Bookmark
- Subscribe
- Mute
- Subscribe to RSS Feed
- Permalink
- Report Inappropriate Content
Highlighting particular week or range of time in stack bar chart or 2 dimension line chart
Hi Team,
I have a requirement to highlight particular week in stack bar chart.On x-axis dimension is week and y-axis is sum of sales and 2nd dimension is products.I want to highlight say z week as it is important for analysis.I know highlight it by different color but want to have some different way.
Another similar requirement is in for line chart.Is there any way to highlight/show particular week data marker different way?
Please let me know in case you need any other info.
Regards,
Mayank
- « Previous Replies
-
- 1
- 2
- Next Replies »
- Mark as New
- Bookmark
- Subscribe
- Mute
- Subscribe to RSS Feed
- Permalink
- Report Inappropriate Content
For stack bar this will be very confusing for users.Can we increase or decrease the width of that particular bar or show horizontal line for that week to showcase this is our imp week?/
Regards,
Mayank
- Mark as New
- Bookmark
- Subscribe
- Mute
- Subscribe to RSS Feed
- Permalink
- Report Inappropriate Content
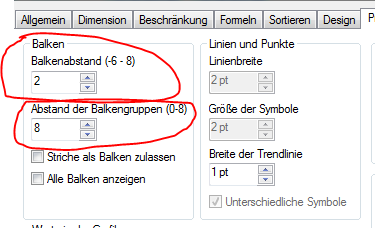
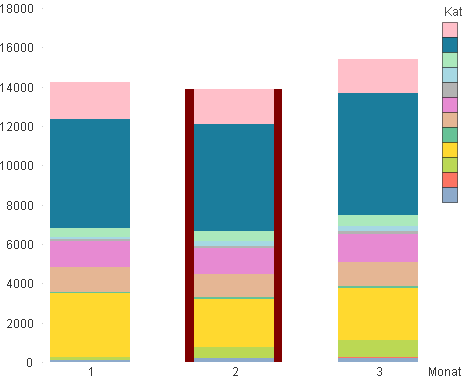
I think this won't be possible. An alternative would be to use two bar-chart which lay over eachother and the lower one is colored on the selected bar the background from the upper one is set to transparency - you might need adjust some of the chart-properties (mostly with transparency instead of hiding because this will lead to changes of the size and position of various chart-parts). If you then changed the distance of the bars within the tab presentation it will look like highlighted (if you are playing with the scale and/or add some amount to your expression the bar could be even higher):


- Marcus
- Mark as New
- Bookmark
- Subscribe
- Mute
- Subscribe to RSS Feed
- Permalink
- Report Inappropriate Content
Hi Anagha,
Your attached app is blank can you send it again.
Regards,
mayank
- Mark as New
- Bookmark
- Subscribe
- Mute
- Subscribe to RSS Feed
- Permalink
- Report Inappropriate Content
Hi Mayank,
Sorry about that. Correct App attached now.
- Mark as New
- Bookmark
- Subscribe
- Mute
- Subscribe to RSS Feed
- Permalink
- Report Inappropriate Content
Thank you Marcus for all your efforts..
- Mark as New
- Bookmark
- Subscribe
- Mute
- Subscribe to RSS Feed
- Permalink
- Report Inappropriate Content
Hi Anagha,
Can you please share the app again/
Regards,
Mayank
- Mark as New
- Bookmark
- Subscribe
- Mute
- Subscribe to RSS Feed
- Permalink
- Report Inappropriate Content
Hi Mayank, Did the above app work for you?
- « Previous Replies
-
- 1
- 2
- Next Replies »