Unlock a world of possibilities! Login now and discover the exclusive benefits awaiting you.
- Qlik Community
- :
- All Forums
- :
- QlikView App Dev
- :
- How can I build a table about how many times a giv...
- Subscribe to RSS Feed
- Mark Topic as New
- Mark Topic as Read
- Float this Topic for Current User
- Bookmark
- Subscribe
- Mute
- Printer Friendly Page
- Mark as New
- Bookmark
- Subscribe
- Mute
- Subscribe to RSS Feed
- Permalink
- Report Inappropriate Content
How can I build a table about how many times a given value has a common feature with others?
Well, I have a table like this:
| Day of Work | Worker |
|---|---|
| Monday | Adam |
| Monday | Bob |
| Monday | Carl |
| Tuesday | Adam |
| Tuesday | Carl |
| Tuesday | Dan |
| Tuesday | Emma |
| Wednesday | Bob |
| Wednesday | Carl |
| Wednesday | Dan |
| Thursday | Bob |
| Thursday | Emma |
| Thursday | Fred |
| Friday | Bob |
| Friday | Carl |
| Friday | Emma |
| Friday | Fred |
And I want to know how many days each Worker worked with Adam, i. e., I want to obtain a table like that:
| Worker | Days |
|---|---|
| Bob | 1 |
| Carl | 2 |
| Dan | 1 |
| Emma | 2 |
| Fred | 1 |
Anyone can help me? Many thanks in advance.
- « Previous Replies
-
- 1
- 2
- Next Replies »
- Mark as New
- Bookmark
- Subscribe
- Mute
- Subscribe to RSS Feed
- Permalink
- Report Inappropriate Content
I tested and it worked both with and without the "1" but still has some problems: my real database has thousands of registers and a bit more variables. And, for example, Adam has worked 417 times with Ben in 2017 and 5 times with Carl in 2016.
So, when I filter by clicking in year = 2016, the table shows Carl and 5.
When I filter by clicking in year = 2017, the table shows Ben and 417.
BUT, when I do not filter (and, so, am considering all years), the table shows only Carl and 5 instead of both rows. Can you say me why is it happening?
- Mark as New
- Bookmark
- Subscribe
- Mute
- Subscribe to RSS Feed
- Permalink
- Report Inappropriate Content
Provide exact expression which you are using in your actual application.
- Mark as New
- Bookmark
- Subscribe
- Mute
- Subscribe to RSS Feed
- Permalink
- Report Inappropriate Content
Count({<NAME -= {'Adam'},WORKDAY = P({1<NAME = {'Adam'}>}WORKDAY)>}Distinct WORKDAY)
- Mark as New
- Bookmark
- Subscribe
- Mute
- Subscribe to RSS Feed
- Permalink
- Report Inappropriate Content
Can you provide sample app or sample data along with Year so that I can work on it?
- Mark as New
- Bookmark
- Subscribe
- Mute
- Subscribe to RSS Feed
- Permalink
- Report Inappropriate Content
Sure. Here follows a sample data of 32 rows:
| YEAR | WORKDAY | NAME |
| 2017 | Day01 | Adam |
| 2017 | Day01 | Ben |
| 2017 | Day02 | Adam |
| 2017 | Day02 | Ben |
| 2016 | Day03 | Adam |
| 2016 | Day03 | Ben |
| 2016 | Day04 | Adam |
| 2016 | Day04 | Ben |
| 2017 | Day05 | Adam |
| 2017 | Day05 | Ben |
| 2016 | Day06 | Adam |
| 2016 | Day07 | Adam |
| 2016 | Day07 | Ben |
| 2016 | Day08 | Adam |
| 2016 | Day08 | Ben |
| 2016 | Day09 | Adam |
| 2016 | Day10 | Adam |
| 2016 | Day10 | Carl |
| 2016 | Day11 | Ben |
| 2016 | Day12 | Ben |
| 2016 | Day13 | Ben |
| 2016 | Day14 | Ben |
| 2016 | Day15 | Ben |
| 2016 | Day16 | Ben |
| 2016 | Day17 | Ben |
| 2016 | Day18 | Carl |
| 2017 | Day19 | Carl |
| 2017 | Day20 | Carl |
| 2017 | Day21 | Carl |
| 2017 | Day22 | Carl |
| 2017 | Day23 | Carl |
| 2017 | Day24 | Carl |
As you can see, Adam worked:
* Three days with Ben in 2017 (Days 01, 02 and 05)
* Four days with Ben in 2016 (Days 03, 04, 07 and 08)
* One day with Carl in 2016 (Day 10)
I'm using the formula
Count({<NAME -= {'Adam'},WORKDAY = P({1<NAME = {'Adam'}>}WORKDAY)>}Distinct WORKDAY)
And getting the following results:
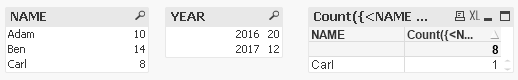
Many thanks in advance for any solution you can find.
- Mark as New
- Bookmark
- Subscribe
- Mute
- Subscribe to RSS Feed
- Permalink
- Report Inappropriate Content
Let me revise what you want?
For your sample data..
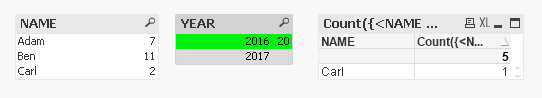
When you select 2016, you need Ben 4 and Carl 1
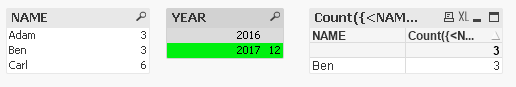
When you select 2017, you need Ben 3
When you not select any year, Ben 7 and Carl 1
Correct me if I am wrong !!
if this is what you need,
use below expression
Count({<NAME -= {'Adam'},WORKDAY = P({1<NAME = {'Adam'}>}WORKDAY)>}Distinct WORKDAY)
- Mark as New
- Bookmark
- Subscribe
- Mute
- Subscribe to RSS Feed
- Permalink
- Report Inappropriate Content
QVW attached for your reference...
- Mark as New
- Bookmark
- Subscribe
- Mute
- Subscribe to RSS Feed
- Permalink
- Report Inappropriate Content
Thanks! It is exactly what I want, but this expression is the same I am already using and that generated the screens above.
- Mark as New
- Bookmark
- Subscribe
- Mute
- Subscribe to RSS Feed
- Permalink
- Report Inappropriate Content
Sorry, but I can't open this qvw:
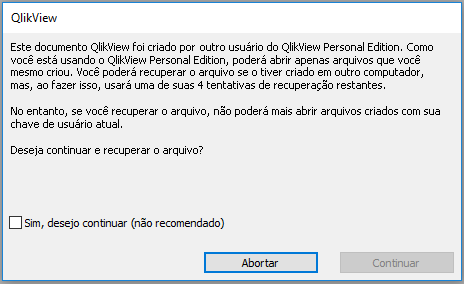
Google translation: "This QlikView document was created by another QlikView Personal Edition user. Since you are using QlikView Personal Edition, you can only open files that you have created yourself. You can recover the file if you have created it on another computer, but doing so will use one of your remaining 4 recovery attempts.
However, if you recover the file, you can no longer open files created with your current user key.
Do you want to continue and recover the file?"
- Mark as New
- Bookmark
- Subscribe
- Mute
- Subscribe to RSS Feed
- Permalink
- Report Inappropriate Content
Well, I solved the problem. It was a big silliness of me.
Note that, in the screens I posted before, the resulting table has (I don't know why) only one row. But now I noted it and dragged the bottom margin, showing the 2nd row, showing the correct numbers.
So, many thanks for all and sorry for my silliness.
- « Previous Replies
-
- 1
- 2
- Next Replies »