Unlock a world of possibilities! Login now and discover the exclusive benefits awaiting you.
- Qlik Community
- :
- All Forums
- :
- QlikView App Dev
- :
- How can i make line chart visible only on x and y ...
- Subscribe to RSS Feed
- Mark Topic as New
- Mark Topic as Read
- Float this Topic for Current User
- Bookmark
- Subscribe
- Mute
- Printer Friendly Page
- Mark as New
- Bookmark
- Subscribe
- Mute
- Subscribe to RSS Feed
- Permalink
- Report Inappropriate Content
How can i make line chart visible only on x and y axis
Hi Everyone
How can i make line chart visible only on x and y axis
|
|
| ______
| ___/ \______
|
|
|
|_____________________________________
I'am sorry for the figure but i want something like this no header,no label,only x and y axis and a line showing the data
Accepted Solutions
- Mark as New
- Bookmark
- Subscribe
- Mute
- Subscribe to RSS Feed
- Permalink
- Report Inappropriate Content
Kumar
Use a Chart of Type Line Chart and on the Expressions tab
- Display Option
- <Tick> Line
- Instead of Normal select Plateau [centre)
- Or one of the pother Plateau options as per your needs.
Best Regards, Bill
- Mark as New
- Bookmark
- Subscribe
- Mute
- Subscribe to RSS Feed
- Permalink
- Report Inappropriate Content
Hi
Are you looking like this
And in caption tab -> Remove caption
Please close the thread by marking correct answer & give likes if you like the post.
- Mark as New
- Bookmark
- Subscribe
- Mute
- Subscribe to RSS Feed
- Permalink
- Report Inappropriate Content
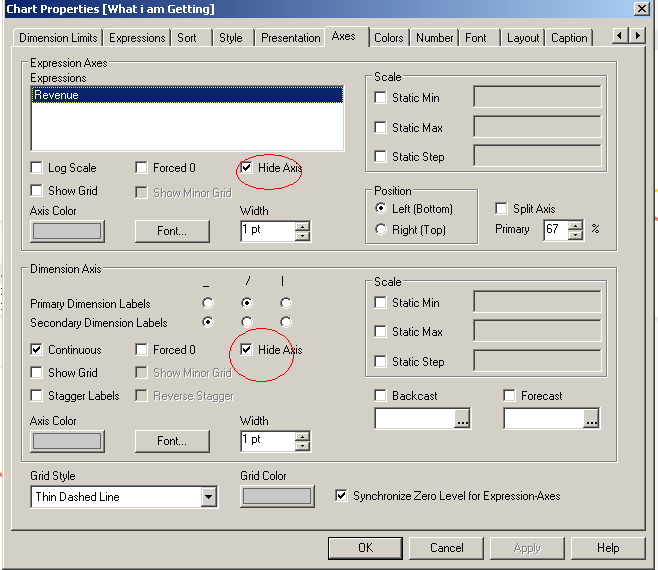
when i selected continious ,the chart disappeared,
- Mark as New
- Bookmark
- Subscribe
- Mute
- Subscribe to RSS Feed
- Permalink
- Report Inappropriate Content
Hi
Can you provide a sample file?
Please close the thread by marking correct answer & give likes if you like the post.
- Mark as New
- Bookmark
- Subscribe
- Mute
- Subscribe to RSS Feed
- Permalink
- Report Inappropriate Content
Kumar
Use a Chart of Type Line Chart and on the Expressions tab
- Display Option
- <Tick> Line
- Instead of Normal select Plateau [centre)
- Or one of the pother Plateau options as per your needs.
Best Regards, Bill
- Mark as New
- Bookmark
- Subscribe
- Mute
- Subscribe to RSS Feed
- Permalink
- Report Inappropriate Content
Hi,
Disable legend in dimension tab and select line as Plateau(Leading)
- Mark as New
- Bookmark
- Subscribe
- Mute
- Subscribe to RSS Feed
- Permalink
- Report Inappropriate Content
Thanks,I got the answer