Unlock a world of possibilities! Login now and discover the exclusive benefits awaiting you.
- Qlik Community
- :
- All Forums
- :
- QlikView App Dev
- :
- How can i show 2 labels at the same time in the li...
Options
- Subscribe to RSS Feed
- Mark Topic as New
- Mark Topic as Read
- Float this Topic for Current User
- Bookmark
- Subscribe
- Mute
- Printer Friendly Page
Turn on suggestions
Auto-suggest helps you quickly narrow down your search results by suggesting possible matches as you type.
Showing results for
Creator III
2017-11-27
05:43 AM
- Mark as New
- Bookmark
- Subscribe
- Mute
- Subscribe to RSS Feed
- Permalink
- Report Inappropriate Content
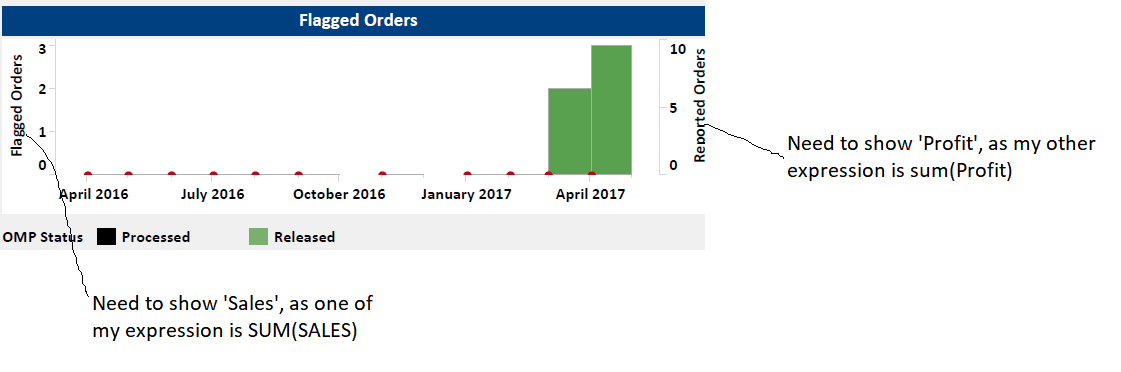
How can i show 2 labels at the same time in the line chart in Y axis?
I have used 2 expression as : Sum(Sales) for bar chart and sum(Profit) for line chart. My intention is show Label 'Sales' at the left side along side the left Y axis and 'Profit' at the right side of the chart along side the right of Y axis like below image:
594 Views
2 Replies
Creator III
2017-11-27
05:56 AM
- Mark as New
- Bookmark
- Subscribe
- Mute
- Subscribe to RSS Feed
- Permalink
- Report Inappropriate Content
you can use "Text in Chart" and then move them by pressing Ctrl + Shift
545 Views
2017-11-27
07:19 AM
- Mark as New
- Bookmark
- Subscribe
- Mute
- Subscribe to RSS Feed
- Permalink
- Report Inappropriate Content
Where these Label text coming from in your image?
Best Anil, When applicable please mark the correct/appropriate replies as "solution" (you can mark up to 3 "solutions". Please LIKE threads if the provided solution is helpful
545 Views