Unlock a world of possibilities! Login now and discover the exclusive benefits awaiting you.
- Qlik Community
- :
- All Forums
- :
- QlikView App Dev
- :
- How do I create a trend chart ?
- Subscribe to RSS Feed
- Mark Topic as New
- Mark Topic as Read
- Float this Topic for Current User
- Bookmark
- Subscribe
- Mute
- Printer Friendly Page
- Mark as New
- Bookmark
- Subscribe
- Mute
- Subscribe to RSS Feed
- Permalink
- Report Inappropriate Content
How do I create a trend chart ?
Greetings 
I am trying to analyze the trends. My client launched a new products where each user accumulate points every month when they participate in some activities.
When they launch the product in Mid July 2013,. they had 103 Members and gradually the membership increased every month.
Now I want to analyze the first 103 members point accumulating trends on monthly basis. how do I create a chart?
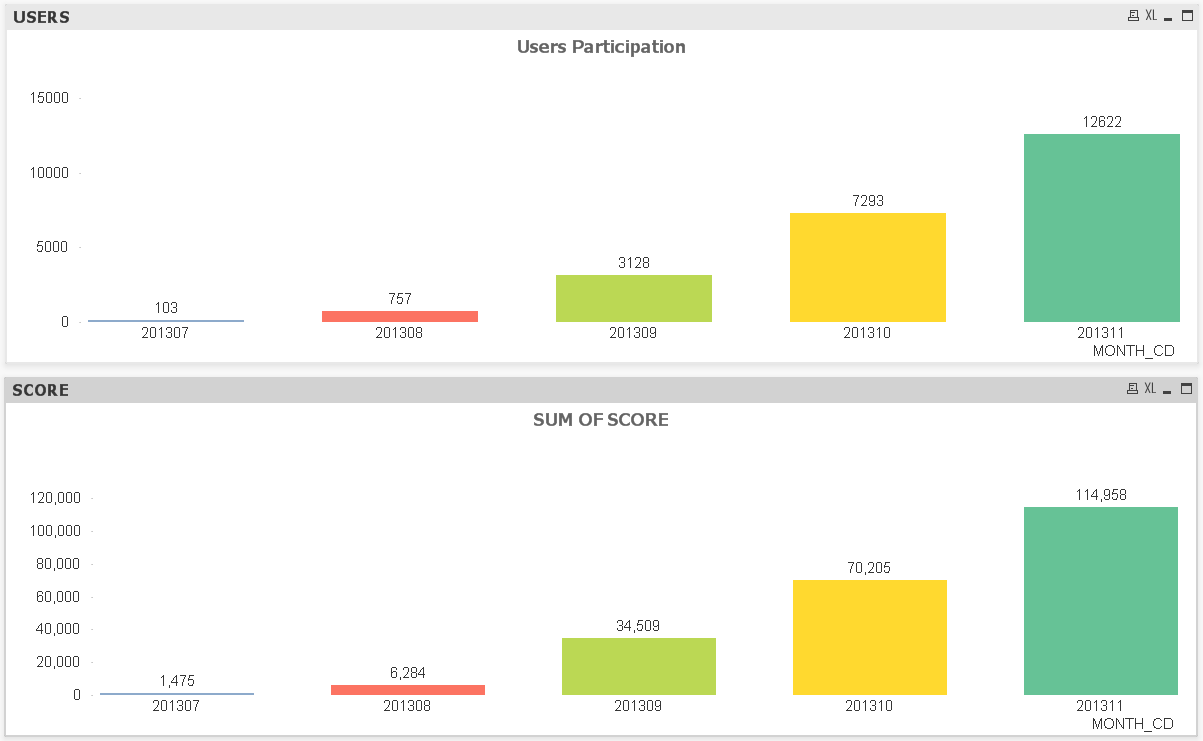
I have created the chart as follows but looks like I am wrong.
Chart 1,
Dimension :MONTH_CD
Expression :COUNT(USER_ID)
Chart 2:
Dimension :MONTH_CD
Expression :SUM(SCORE)
When I select Month 201307, then I am unable to see 201308,201309 etc for the users who participated in 201307. How do I analyze the trend for selective users?
Thank you
- « Previous Replies
-
- 1
- 2
- Next Replies »
Accepted Solutions
- Mark as New
- Bookmark
- Subscribe
- Mute
- Subscribe to RSS Feed
- Permalink
- Report Inappropriate Content
If you actually want to select the users active on the month which you are selecting, you would need something like a 'Select possible values' on the user field. You can either do this by using the context menu on the list box, or use set analysis with implicite field value definitions, i.e. the p() function.
Something along these lines:
=Sum({<USER_ID = p(), MONTH_CD= >}SCORE)
- Mark as New
- Bookmark
- Subscribe
- Mute
- Subscribe to RSS Feed
- Permalink
- Report Inappropriate Content
Try a cyclic group with Month and UserId
- Mark as New
- Bookmark
- Subscribe
- Mute
- Subscribe to RSS Feed
- Permalink
- Report Inappropriate Content
If you actually want to select the users active on the month which you are selecting, you would need something like a 'Select possible values' on the user field. You can either do this by using the context menu on the list box, or use set analysis with implicite field value definitions, i.e. the p() function.
Something along these lines:
=Sum({<USER_ID = p(), MONTH_CD= >}SCORE)
- Mark as New
- Bookmark
- Subscribe
- Mute
- Subscribe to RSS Feed
- Permalink
- Report Inappropriate Content
you can use probable function in set analysis.
= sum({<USER_ID = p({<MONTH_CD={201307}>})>}SCORE)
- Mark as New
- Bookmark
- Subscribe
- Mute
- Subscribe to RSS Feed
- Permalink
- Report Inappropriate Content
MONTH_CD is user selectable. If I use this statement in expression directly it is qv shows as error.
- Mark as New
- Bookmark
- Subscribe
- Mute
- Subscribe to RSS Feed
- Permalink
- Report Inappropriate Content
Thanks Kumar
Now you have hard coded MONTH_CD=201307 how do i make this user selectable from list box?
Also some user who participate in 201307 may not participate in 201308 or other months. So is their any way I can show the count for the users?
- Mark as New
- Bookmark
- Subscribe
- Mute
- Subscribe to RSS Feed
- Permalink
- Report Inappropriate Content
Thanks for the reply
Am I missing something?
In Dimension Edit Group-> New Group -> Added USER_ID and MONTH_CD
Then added the New Group to Dimension
When I click the cyclic icon entire users are populated. making it difficult to analyze.
- Mark as New
- Bookmark
- Subscribe
- Mute
- Subscribe to RSS Feed
- Permalink
- Report Inappropriate Content
MONTH_CD is user selectable. If I use this statement in expression directly it is qv shows as error.
Does it just show the red underlines, but saying 'Expression ok'? Could just be the known bug in the syntax checker.
If possible, post a small sample application.
- Mark as New
- Bookmark
- Subscribe
- Mute
- Subscribe to RSS Feed
- Permalink
- Report Inappropriate Content
you can use a variable instead of hard coding it.
vMonth=getSelectedValue(MONTH_CD)
then selected value in list box reflected here.
for count of users, a set analysis equation is:
= Count({<USER_ID = p({<MONTH_CD={201307}>})>}USER_ID)
- Mark as New
- Bookmark
- Subscribe
- Mute
- Subscribe to RSS Feed
- Permalink
- Report Inappropriate Content
Hi Nuthan Kumar
Thanks for the help.
I am using Qlikview version 11.20.12235.0
Looks like getSelectedValue function is not supported. Am I making any mistake?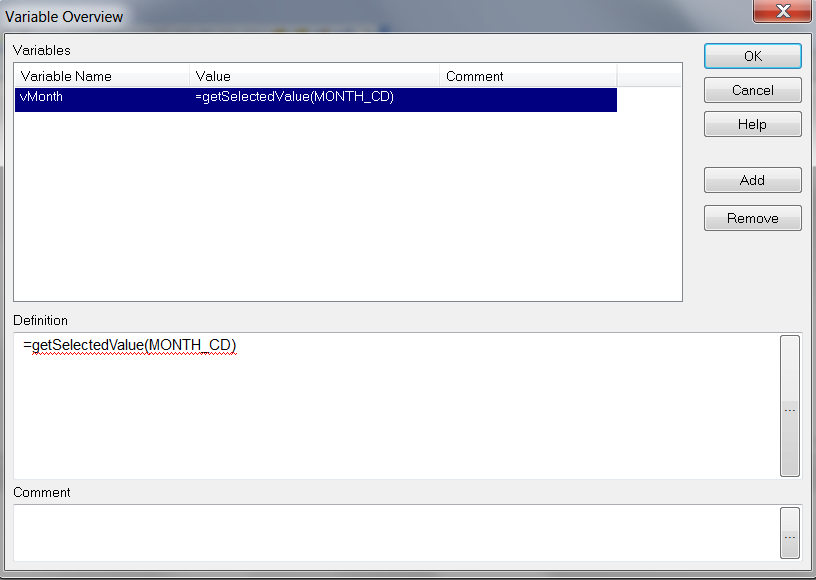
- « Previous Replies
-
- 1
- 2
- Next Replies »