Unlock a world of possibilities! Login now and discover the exclusive benefits awaiting you.
- Qlik Community
- :
- All Forums
- :
- QlikView App Dev
- :
- How to Count Distinct within a range?
- Subscribe to RSS Feed
- Mark Topic as New
- Mark Topic as Read
- Float this Topic for Current User
- Bookmark
- Subscribe
- Mute
- Printer Friendly Page
- Mark as New
- Bookmark
- Subscribe
- Mute
- Subscribe to RSS Feed
- Permalink
- Report Inappropriate Content
How to Count Distinct within a range?
Hi,
I am quite new to QlikView, few programming skills. I would like to define an expression in a chart in order to cumulative count distinct costumers.
Example
Table
| Day | Customer |
| 1 | A |
| 1 | B |
| 1 | C |
| 1 | A |
| 2 | D |
| 2 | A |
| 2 | E |
| 3 | B |
| 3 | F |
| 3 | F |
Result
| Day | Count |
| 1 | 3 |
| 2 | 5 |
| 3 | 6 |
Thanks
- Mark as New
- Bookmark
- Subscribe
- Mute
- Subscribe to RSS Feed
- Permalink
- Report Inappropriate Content
What is the logic behind this? I am not sure how 5 & 6 are coming into the view. Would you explain more?
- Mark as New
- Bookmark
- Subscribe
- Mute
- Subscribe to RSS Feed
- Permalink
- Report Inappropriate Content
Day 1 (cumulative distinct values) : 3 (A,B,C)
Day 2 (cumulative distinct values): 5 (A,B,C,D,E)
Day 3 (cumulative distinct values): 6 (A,B,C,D,E,F)
please let me know if it is clear now
Thanks
- Mark as New
- Bookmark
- Subscribe
- Mute
- Subscribe to RSS Feed
- Permalink
- Report Inappropriate Content
Hi,
maybe one solution could be to use an The As-Of Table:
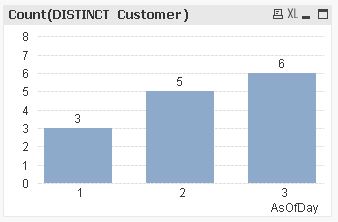
Table:
LOAD * INLINE [
    Day, Customer
    1, A
    1, B
    1, C
    1, A
    2, D
    2, A
    2, E
    3, B
    3, F
    3, F
];

TabAsOfDays:
LOAD IterNo() as Day,
    Day as AsOfDay
Resident Table
While IterNo()<=Day;
hope this helps
regards
Marco
- Mark as New
- Bookmark
- Subscribe
- Mute
- Subscribe to RSS Feed
- Permalink
- Report Inappropriate Content
Thanks for the answer, i couldn't get to work it yet since i have more fields.
Market
Year
Campaign
Day
Customer
This would work as well?
the idea es to have different values for every Market_Year_Campaign selected.