Unlock a world of possibilities! Login now and discover the exclusive benefits awaiting you.
- Qlik Community
- :
- All Forums
- :
- QlikView App Dev
- :
- How to Create Two Custom rows in Table
- Subscribe to RSS Feed
- Mark Topic as New
- Mark Topic as Read
- Float this Topic for Current User
- Bookmark
- Subscribe
- Mute
- Printer Friendly Page
- Mark as New
- Bookmark
- Subscribe
- Mute
- Subscribe to RSS Feed
- Permalink
- Report Inappropriate Content
How to Create Two Custom rows in Table
I have simple Excel file with tabular data which i loaded in my qvw. Now i need to add couple of calculation in it. The loaded file look like this
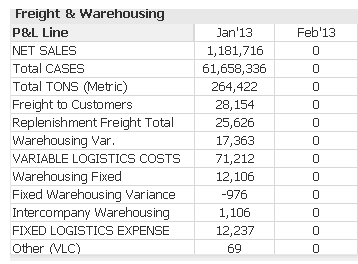
Want to add these calculations
1. Trying to create a 'Total Costs' line = 'VARIABLE LOGISTICS COSTS' + 'FIXED LOGISTICS EXPENSE' + 'Other (VLC)
2. Then also 'Total % of Net Sales' = 'Total Costs'/ 'NET SALES'
3. Also trying to create a Column 'Q1A' = 'Jan'13' + 'Feb'13' + 'Mar'13'
The script is simple load from sheet
- Mark as New
- Bookmark
- Subscribe
- Mute
- Subscribe to RSS Feed
- Permalink
- Report Inappropriate Content
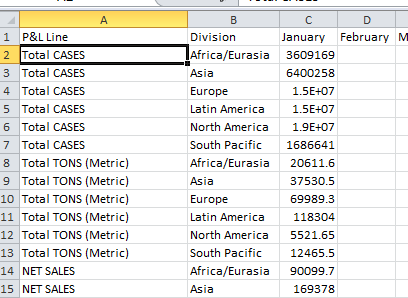
You are going to find it more flexible if you load that sort of data as a CROSS TABLE. While you can aggregate or total values now, it's making it hard on yourself and less flexible or extensible. A cross table will give you a table with columns for P&L line, Division, Date, and Amount. So then you can aggregate very easily in any way you want. You can use the Table Files... load wizard to load as cross table (last page of this wizard), or code and it'll looke something like this:
Temp:
CrossTable(Date_Tmp, Amount, 2)
LOAD [P&L Line],
Division,
[41275], // this will vary depending on source (I just did a quick sample in Excel
[41306],
[41334]
FROM
... (your load source)
Fact:
NoConcatenate LOAD
*,
Date(num#(Date_Tmp)) As Date
Resident Temp;
Drop Table Temp;
Drop Field Date_Tmp;
- Mark as New
- Bookmark
- Subscribe
- Mute
- Subscribe to RSS Feed
- Permalink
- Report Inappropriate Content
Hi Thank you for your reply.. i am very young in qlikview,, not even month
old,,so really appreciate if you get me going. here is excel and simple
qvw,, please just help me adding one two more rows as explain in my
question .
Regards-
Faisal Mehmood
Colgate Palmolive - GD BW/BI Core Team
+1 973 630 1489
- Mark as New
- Bookmark
- Subscribe
- Mute
- Subscribe to RSS Feed
- Permalink
- Report Inappropriate Content
You can create the subtotals in a pivot chart using Show Partial Sums. If you create a field for the quarters you can also show the subtotals per quarter . See attached example.
talk is cheap, supply exceeds demand
- Mark as New
- Bookmark
- Subscribe
- Mute
- Subscribe to RSS Feed
- Permalink
- Report Inappropriate Content
Thank You for your reply. I am also looking for additional element in P&L Line
1. Trying to create a 'Total Costs' line = 'VARIABLE LOGISTICS COSTS' + 'FIXED LOGISTICS EXPENSE' + 'Other (VLC)
2. Then also 'Total % of Net Sales' = 'Total Costs'/ 'NET SALES'
- Mark as New
- Bookmark
- Subscribe
- Mute
- Subscribe to RSS Feed
- Permalink
- Report Inappropriate Content
See here
talk is cheap, supply exceeds demand
- Mark as New
- Bookmark
- Subscribe
- Mute
- Subscribe to RSS Feed
- Permalink
- Report Inappropriate Content
HI Sir , i saw this exanmple , but it does not tell me how to add three values from one column and make it another row ..
P&L Line is column heading with list of values and i want to add these three out of those and make it another row.
1. Trying to create a 'Total Costs' line = 'VARIABLE LOGISTICS COSTS' + 'FIXED LOGISTICS EXPENSE' + 'Other (VLC)
- Mark as New
- Bookmark
- Subscribe
- Mute
- Subscribe to RSS Feed
- Permalink
- Report Inappropriate Content
It does tell you how to do that. But I guess you don't like to do it that way. However the way you probably want to do it is simply not possible. Qlikview is not a spreadsheet. Use a real spreadsheet application to define the layout and which rows should be aggregated.
talk is cheap, supply exceeds demand