Unlock a world of possibilities! Login now and discover the exclusive benefits awaiting you.
- Qlik Community
- :
- All Forums
- :
- QlikView App Dev
- :
- How to Create different charts for different selec...
- Subscribe to RSS Feed
- Mark Topic as New
- Mark Topic as Read
- Float this Topic for Current User
- Bookmark
- Subscribe
- Mute
- Printer Friendly Page
- Mark as New
- Bookmark
- Subscribe
- Mute
- Subscribe to RSS Feed
- Permalink
- Report Inappropriate Content
How to Create different charts for different selection in a sheet?
Hi ,
Is there any way of creating different charts for different selections in the same sheet of Qlikview document.
My requirement is to display relevant chart with respect to a particular selection hiding the other charts.
Thanks,
Vaneet
- « Previous Replies
-
- 1
- 2
- Next Replies »
- Mark as New
- Bookmark
- Subscribe
- Mute
- Subscribe to RSS Feed
- Permalink
- Report Inappropriate Content
So you can create your charts and then add the following
IF(Region = 'A',1,0) or IF(Region = 'B',1,0) and so on for each region
Add the above IF statement to the Show Conditional in the layout tab for each chart.
Here is an attached image of where to change this

- Mark as New
- Bookmark
- Subscribe
- Mute
- Subscribe to RSS Feed
- Permalink
- Report Inappropriate Content
You can create different charts, and "show" conditions will be different for each chart:
region='A'
region='B'
region='C'
...
Regards,
Michael
- Mark as New
- Bookmark
- Subscribe
- Mute
- Subscribe to RSS Feed
- Permalink
- Report Inappropriate Content
Thanks Alan.With your above mentioned approach i am able to show graph as per the selections but not exactly on the same place.I want to replace a chart exactly at the same place in my sheet as per the selection. I tried one approach by creating a clone but it's not very effective. Can you suggest something ?
Thanks,
Vaneet
- Mark as New
- Bookmark
- Subscribe
- Mute
- Subscribe to RSS Feed
- Permalink
- Report Inappropriate Content
You can use a container -> new sheet object\container -> include the different charts and position the container. The title of the chart will be used as selection option. You also do not need (and need to remove) the conditional show option.
- Mark as New
- Bookmark
- Subscribe
- Mute
- Subscribe to RSS Feed
- Permalink
- Report Inappropriate Content
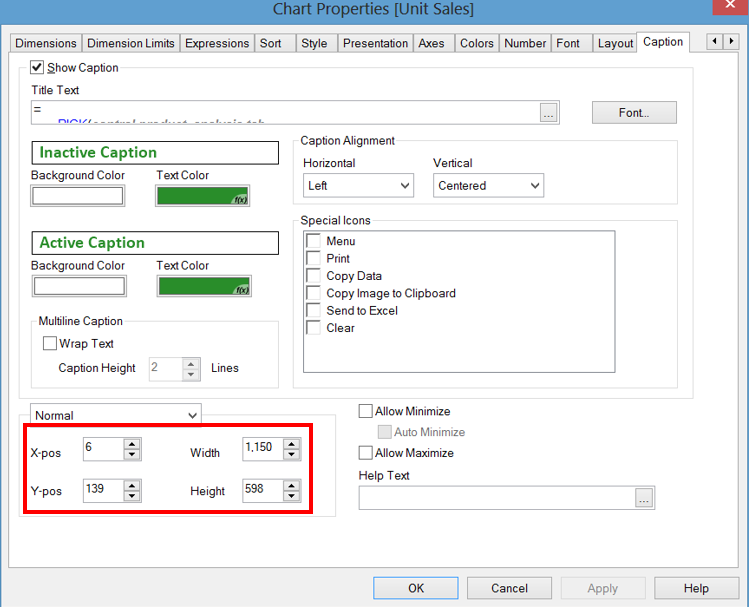
Vaneet,
To make sure the charts are in same place and the same size, you can use X-pos, Y-pos, Width, and Hight - all on the Caption tab.
Regards,
Michael
- Mark as New
- Bookmark
- Subscribe
- Mute
- Subscribe to RSS Feed
- Permalink
- Report Inappropriate Content
When you create a new chart copy the x and y positions from the original chart
and then the new chart when selected from your button will cover the old chart
X-pos and Y-pos and the height and width should be the same to make it look correct
See below image
- Mark as New
- Bookmark
- Subscribe
- Mute
- Subscribe to RSS Feed
- Permalink
- Report Inappropriate Content
Thanks all.
- Mark as New
- Bookmark
- Subscribe
- Mute
- Subscribe to RSS Feed
- Permalink
- Report Inappropriate Content
you need to give points to the correct answer and helpful answers, so other users will find what they need!
- Mark as New
- Bookmark
- Subscribe
- Mute
- Subscribe to RSS Feed
- Permalink
- Report Inappropriate Content
Hello Alan Farrell,
Its works fine, if we have subregion filter have 100 values how can we hard code in expressions in layout tab
Kindly send me any expression for this situation....
Regards,
Ram.
- « Previous Replies
-
- 1
- 2
- Next Replies »