Unlock a world of possibilities! Login now and discover the exclusive benefits awaiting you.
- Qlik Community
- :
- All Forums
- :
- QlikView App Dev
- :
- How to add a column in a pivot table
- Subscribe to RSS Feed
- Mark Topic as New
- Mark Topic as Read
- Float this Topic for Current User
- Bookmark
- Subscribe
- Mute
- Printer Friendly Page
- Mark as New
- Bookmark
- Subscribe
- Mute
- Subscribe to RSS Feed
- Permalink
- Report Inappropriate Content
How to add a column in a pivot table
I've got a pivot table which shows me the total of Sales for different dates.
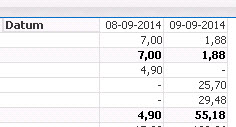
How to add a new column which shows me the totals for all dates?
F.e: extra colum "Total" first row 7,00 + 1,88 = 8,88
Accepted Solutions
- Mark as New
- Bookmark
- Subscribe
- Mute
- Subscribe to RSS Feed
- Permalink
- Report Inappropriate Content
Hi,
Go Chart Properties>Presentation>Check on show partial sums.While doing this the dimension 'Datum' should be selected in the Dimensions & Expressions box present in the Presentation tab.
- Mark as New
- Bookmark
- Subscribe
- Mute
- Subscribe to RSS Feed
- Permalink
- Report Inappropriate Content
Go in presentation bar, click on the field (they are in a list box on the top left of the tab) then click on show partial sum
let me know ...
- Mark as New
- Bookmark
- Subscribe
- Mute
- Subscribe to RSS Feed
- Permalink
- Report Inappropriate Content
Hi,
Go Chart Properties>Presentation>Check on show partial sums.While doing this the dimension 'Datum' should be selected in the Dimensions & Expressions box present in the Presentation tab.
- Mark as New
- Bookmark
- Subscribe
- Mute
- Subscribe to RSS Feed
- Permalink
- Report Inappropriate Content
I am not able to edit this field (grey-out).
It's possible to edit the partial sum for dimensions, not for the expression