Unlock a world of possibilities! Login now and discover the exclusive benefits awaiting you.
- Qlik Community
- :
- All Forums
- :
- QlikView App Dev
- :
- How to add mathematical function ??
- Subscribe to RSS Feed
- Mark Topic as New
- Mark Topic as Read
- Float this Topic for Current User
- Bookmark
- Subscribe
- Mute
- Printer Friendly Page
- Mark as New
- Bookmark
- Subscribe
- Mute
- Subscribe to RSS Feed
- Permalink
- Report Inappropriate Content
How to add mathematical function ??
I have sales of 12 months but in different columns and I want to add them all in a column as Month and also wants to perform the sum of sales of that. So how can I perform ??
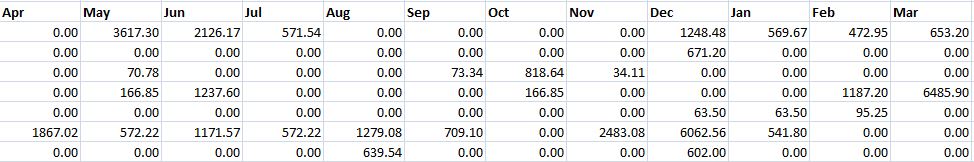
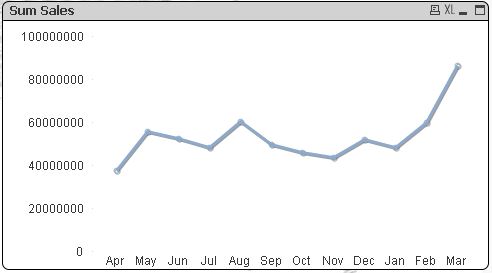
This is current data and wants to make chart as like this :-
- « Previous Replies
-
- 1
- 2
- Next Replies »
- Mark as New
- Bookmark
- Subscribe
- Mute
- Subscribe to RSS Feed
- Permalink
- Report Inappropriate Content
Hi
You can use the cross table concept for this
Like this
[Month Sales]:
CrossTable(Month, Sales)
LOAD Department,
Jan,
Feb,
Mar,
Apr,
May,
Jun,
Jul,
Aug,
Sep,
Oct,
Nov,
Dec
FROM
[Data Files\Excel\cross table.xlsx]
(ooxml, embedded labels, table is Sheet1);
- Mark as New
- Bookmark
- Subscribe
- Mute
- Subscribe to RSS Feed
- Permalink
- Report Inappropriate Content
Select the Line chart and
Dimension is Month
Expression is Sum(Sales)
- Mark as New
- Bookmark
- Subscribe
- Mute
- Subscribe to RSS Feed
- Permalink
- Report Inappropriate Content
Thanks to u all..
But I want to use without CROSS TABLE. Is any method without Cross table ????
- Mark as New
- Bookmark
- Subscribe
- Mute
- Subscribe to RSS Feed
- Permalink
- Report Inappropriate Content
Hi
try with the Pivot table
Dimension is Month
Expression is Sum(Sales)
after finish the chart drag the month to upwards...
- Mark as New
- Bookmark
- Subscribe
- Mute
- Subscribe to RSS Feed
- Permalink
- Report Inappropriate Content
Thanks..
But I want to make a line chart,, So plz suggest for that..
- Mark as New
- Bookmark
- Subscribe
- Mute
- Subscribe to RSS Feed
- Permalink
- Report Inappropriate Content
Take line char and add
Dimension is Month
Expression is Sum(Sales)
- Mark as New
- Bookmark
- Subscribe
- Mute
- Subscribe to RSS Feed
- Permalink
- Report Inappropriate Content
Why don't you want to use a crosstable load?
- Mark as New
- Bookmark
- Subscribe
- Mute
- Subscribe to RSS Feed
- Permalink
- Report Inappropriate Content
Thanks to u all.. We cant use this without Cross Table..
If anyone know how to do it without Cross Table then plz tell me..
Thanks again.
- Mark as New
- Bookmark
- Subscribe
- Mute
- Subscribe to RSS Feed
- Permalink
- Report Inappropriate Content
USe crosstable function
- « Previous Replies
-
- 1
- 2
- Next Replies »