Unlock a world of possibilities! Login now and discover the exclusive benefits awaiting you.
- Qlik Community
- :
- All Forums
- :
- QlikView App Dev
- :
- How to add % of Total in a Pivot Chart
- Subscribe to RSS Feed
- Mark Topic as New
- Mark Topic as Read
- Float this Topic for Current User
- Bookmark
- Subscribe
- Mute
- Printer Friendly Page
- Mark as New
- Bookmark
- Subscribe
- Mute
- Subscribe to RSS Feed
- Permalink
- Report Inappropriate Content
How to add % of Total in a Pivot Chart
I have what seems to be a very basic data cross-tab table to be built, but yet have not found a way to do this easily with QVW.
I have created a basic cross tab, Sales by Product (row) and Year (column). How do I add % of Total in this table, with total being total for a year?
I have attached the sample QVW. Any help would be greatly appreciated!
ST
Accepted Solutions
- Mark as New
- Bookmark
- Subscribe
- Mute
- Subscribe to RSS Feed
- Permalink
- Report Inappropriate Content
Hi Sau,
Try this:
sum(Sales)/sum(TOTAL<Year> Sales)
See attached for more details.
Best,
Matt
- Mark as New
- Bookmark
- Subscribe
- Mute
- Subscribe to RSS Feed
- Permalink
- Report Inappropriate Content
Hi Sau,
Try this:
sum(Sales)/sum(TOTAL<Year> Sales)
See attached for more details.
Best,
Matt
- Mark as New
- Bookmark
- Subscribe
- Mute
- Subscribe to RSS Feed
- Permalink
- Report Inappropriate Content
Hi Sau,
Did that work for you?
Best,
Matt
- Mark as New
- Bookmark
- Subscribe
- Mute
- Subscribe to RSS Feed
- Permalink
- Report Inappropriate Content
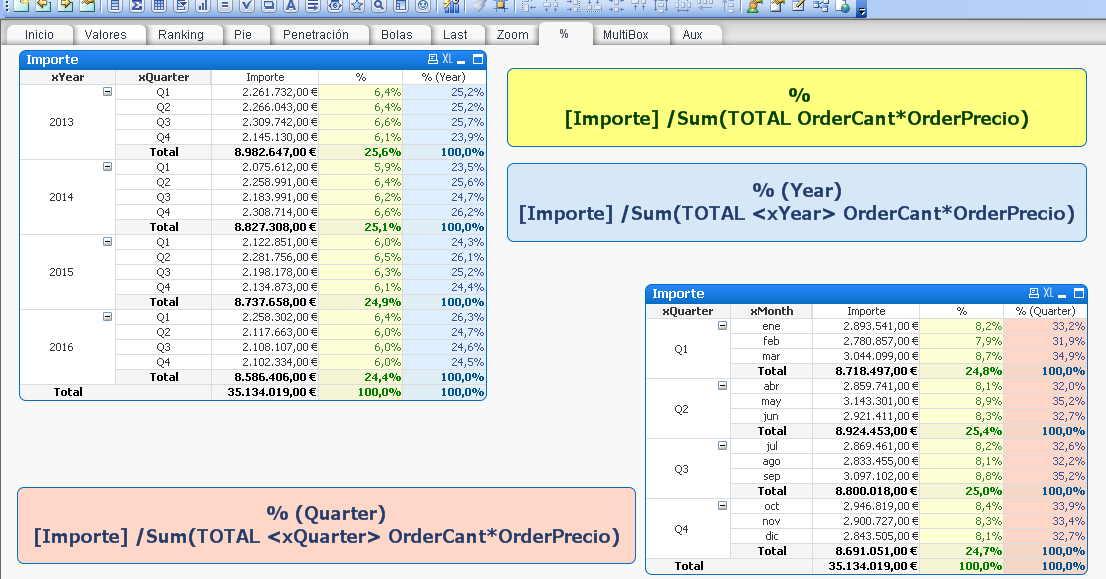
Here you have an example
- Mark as New
- Bookmark
- Subscribe
- Mute
- Subscribe to RSS Feed
- Permalink
- Report Inappropriate Content
Thank you very much! That worked too!
- Mark as New
- Bookmark
- Subscribe
- Mute
- Subscribe to RSS Feed
- Permalink
- Report Inappropriate Content
Thank you for the speedy response Matt! It worked like a charm...
Much appreciated,
ST
- Mark as New
- Bookmark
- Subscribe
- Mute
- Subscribe to RSS Feed
- Permalink
- Report Inappropriate Content
Let me throw you a zinger. What if my Year dimension is a drill-down group that has Year, Quarter, Month?
Or, actually what if the column has nested columns Year, Quarter, Month, that you can drill in, or expand (instead of a group)?
How can I make the formula dynamic to know the group level?
Thanks again,
ST
- Mark as New
- Bookmark
- Subscribe
- Mute
- Subscribe to RSS Feed
- Permalink
- Report Inappropriate Content
I replied to my original post, but what if my Year dimension is a drilldown group that looks like this: Year, Quarter, Month?
st