Unlock a world of possibilities! Login now and discover the exclusive benefits awaiting you.
- Qlik Community
- :
- All Forums
- :
- QlikView App Dev
- :
- How to add/show two or more trend lines in scatter...
- Subscribe to RSS Feed
- Mark Topic as New
- Mark Topic as Read
- Float this Topic for Current User
- Bookmark
- Subscribe
- Mute
- Printer Friendly Page
- Mark as New
- Bookmark
- Subscribe
- Mute
- Subscribe to RSS Feed
- Permalink
- Report Inappropriate Content
How to add/show two or more trend lines in scatter plot?
Hello All,
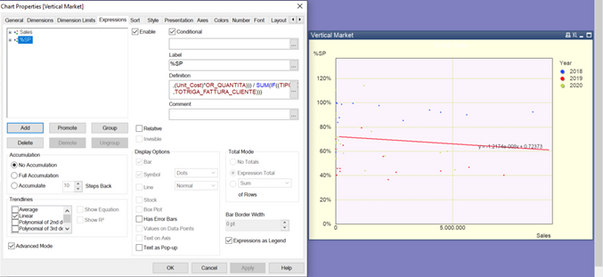
I am developing a scatter chart that shows Sales Value in X axis and SP% in Y axis(Expressions) based on years 2018, 2019, and 2020(Dimensions). I want to show trend lines for each of these years. Is it possible? In the Trendline, when I gave Linear, it shows Trendline for all the years included. But is it possible to show separate Trendline for 2018, a a separate trendline for 2019 and a separate one for 2020?
Expected Output:
I need to show trendline like below in QlikView. This shows trendline for 2018 and one for 2019 seperately.
- « Previous Replies
-
- 1
- 2
- Next Replies »
- Mark as New
- Bookmark
- Subscribe
- Mute
- Subscribe to RSS Feed
- Permalink
- Report Inappropriate Content
@Kushal_Chawda Just doing another notification in case something happened on the last one given the problems we have been having with things, poster had a few follow-up questions if you have time, thanks as always.
Regards,
Brett
I now work a compressed schedule, Tuesday, Wednesday and Thursday, so those will be the days I will reply to any follow-up posts.
- « Previous Replies
-
- 1
- 2
- Next Replies »

