Unlock a world of possibilities! Login now and discover the exclusive benefits awaiting you.
- Qlik Community
- :
- All Forums
- :
- QlikView App Dev
- :
- How to analyze data based on possible value in fie...
- Subscribe to RSS Feed
- Mark Topic as New
- Mark Topic as Read
- Float this Topic for Current User
- Bookmark
- Subscribe
- Mute
- Printer Friendly Page
- Mark as New
- Bookmark
- Subscribe
- Mute
- Subscribe to RSS Feed
- Permalink
- Report Inappropriate Content
How to analyze data based on possible value in field x , due to selection in field y ?
Hello Sirs ,
How to analyze data depending on possible value in field x , due to selection in field y ?
Business Case
The moment i select any Area , i should get its corresponding Region (which i gotted already)...
1) Chart with sales of all the area falling under corresponding zone
2) Chart with two bars - one bar showing sale of selected Area while another bar showing sale of that area which is having highest sale under corresponding region
Simple example
On selection of Area A1 , i should get a sales bar graph oF all the Area under Region R1 as A1 is under Region R1
On selection of Area A1 , i should get a sales bar graph oF for Area A1 and A7,A8 as both have highest sales values under Region R1
Data is inline load .
Thank you .
Accepted Solutions
- Mark as New
- Bookmark
- Subscribe
- Mute
- Subscribe to RSS Feed
- Permalink
- Report Inappropriate Content
Is this what you were looking for ?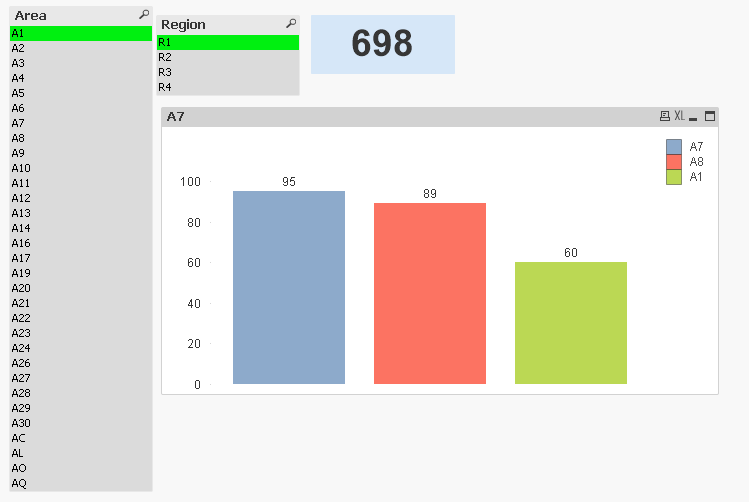
- Mark as New
- Bookmark
- Subscribe
- Mute
- Subscribe to RSS Feed
- Permalink
- Report Inappropriate Content
Sir can you please help . You help me last time i remember .
- Mark as New
- Bookmark
- Subscribe
- Mute
- Subscribe to RSS Feed
- Permalink
- Report Inappropriate Content
Hi
did you try below approach
Sum( {<Area=,Region=P(Region)>} Sales)
- Mark as New
- Bookmark
- Subscribe
- Mute
- Subscribe to RSS Feed
- Permalink
- Report Inappropriate Content
Is this what you were looking for ?
- Mark as New
- Bookmark
- Subscribe
- Mute
- Subscribe to RSS Feed
- Permalink
- Report Inappropriate Content
Thank You Sir . It helped for one requirement .
If you can Please explain P and E function , i always tried to understand it gets more confusing
- Mark as New
- Bookmark
- Subscribe
- Mute
- Subscribe to RSS Feed
- Permalink
- Report Inappropriate Content
Thank You Mam
- Mark as New
- Bookmark
- Subscribe
- Mute
- Subscribe to RSS Feed
- Permalink
- Report Inappropriate Content
A slight change actually i want A1 A7 A8 without selection of R1 in Region .. just selection of A1 in area should give me that result
- Mark as New
- Bookmark
- Subscribe
- Mute
- Subscribe to RSS Feed
- Permalink
- Report Inappropriate Content
P is basically possible values for a field and E is excluded
in the expression i shared i am getting all possible values of region (which when A1 is selected is R1)
they are useful.
for your problem you may need to use them plus the solution from neelam
more is available https://help.qlik.com/en-US/sense/June2018/Subsystems/Hub/Content/ChartFunctions/SetAnalysis/set-mod...