Unlock a world of possibilities! Login now and discover the exclusive benefits awaiting you.
- Qlik Community
- :
- All Forums
- :
- QlikView App Dev
- :
- How to assign only Max of Fiscal Month in front of...
- Subscribe to RSS Feed
- Mark Topic as New
- Mark Topic as Read
- Float this Topic for Current User
- Bookmark
- Subscribe
- Mute
- Printer Friendly Page
- Mark as New
- Bookmark
- Subscribe
- Mute
- Subscribe to RSS Feed
- Permalink
- Report Inappropriate Content
How to assign only Max of Fiscal Month in front of MonthYear Dimension
Hi Experts,
I have a data set where i have MonthYear,Sales and fiscalYear.
I have to create a table in the front end where i have show Sales by MonthYear and another column where i need to show the max month of each fiscal year.
Below is the expected output:
| MonthName | sum(Sales) | Max fiscal Month | Desired Output of column |
| 8574 | |||
| Apr 2015 | 12 | Jul-2016 | Mar-2016 |
| May 2015 | 234 | Jul-2016 | Mar-2016 |
| Jun 2015 | 3 | Jul-2016 | Mar-2016 |
| Jul 2015 | 534 | Jul-2016 | Mar-2016 |
| Aug 2015 | 6435 | Jul-2016 | Mar-2016 |
| Sep 2015 | 34 | Jul-2016 | Mar-2016 |
| Oct 2015 | 32 | Jul-2016 | Mar-2016 |
| Nov 2015 | 35 | Jul-2016 | Mar-2016 |
| Dec 2015 | 4 | Jul-2016 | Mar-2016 |
| Jan 2016 | 345 | Jul-2016 | Mar-2016 |
| Feb 2016 | 25 | Jul-2016 | Mar-2016 |
| Mar 2016 | 56 | Jul-2016 | Mar-2016 |
| Apr 2016 | 78 | Jul-2016 | Jul-2016 |
| May 2016 | 657 | Jul-2016 | Jul-2016 |
| Jun 2016 | 45 | Jul-2016 | Jul-2016 |
| Jul 2016 | 45 | Jul-2016 | Jul-2016 |
Input Data:
LOAD MonthName(MonthYear) as MonthName,MonthYear,Sales,fiscalYear Inline
[
MonthYear,Sales,fiscalYear
04/01/2015,12,2016
05/01/2015,234,2016
06/01/2015,3,2016
07/01/2015,534,2016
08/01/2015,6435,2016
09/01/2015,34,2016
10/01/2015,32,2016
11/01/2015,35,2016
12/01/2015,4,2016
01/01/2016,345,2016
02/01/2016,25,2016
03/01/2016,56,2016
04/01/2016,78,2017
05/01/2016,657,2017
06/01/2016,45,2017
07/01/2016,45,2017
];
Thanks in Advance
Accepted Solutions
- Mark as New
- Bookmark
- Subscribe
- Mute
- Subscribe to RSS Feed
- Permalink
- Report Inappropriate Content
Try this for Sales Output
=Aggr(FirstSortedValue(TOTAL <fiscalYear> Aggr(Sum(Sales), MonthYear), -MonthYear), MonthYear, fiscalYear)
- Mark as New
- Bookmark
- Subscribe
- Mute
- Subscribe to RSS Feed
- Permalink
- Report Inappropriate Content
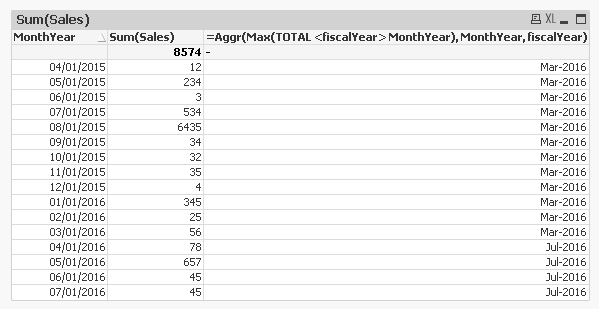
May be try this as your expression:
=Aggr(Max(TOTAL <fiscalYear> MonthYear), MonthYear, fiscalYear)
- Mark as New
- Bookmark
- Subscribe
- Mute
- Subscribe to RSS Feed
- Permalink
- Report Inappropriate Content
Hi Sunny,
Thanks for your quick reply..
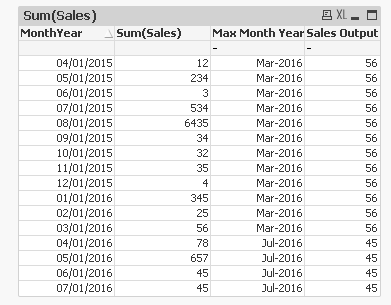
there is one more thing i want to do in the same line .. like I also want to show the value of sum(sales) of last month of each fiscal to all the month of that fiscal.
Output should be like below:
| MonthName | sum(Sales) | Max fiscal Month | Desired Output of column | Sales Output |
| 8574 | ||||
| Apr 2015 | 12 | Jul-2016 | Mar-2016 | 56 |
| May 2015 | 234 | Jul-2016 | Mar-2016 | 56 |
| Jun 2015 | 3 | Jul-2016 | Mar-2016 | 56 |
| Jul 2015 | 534 | Jul-2016 | Mar-2016 | 56 |
| Aug 2015 | 6435 | Jul-2016 | Mar-2016 | 56 |
| Sep 2015 | 34 | Jul-2016 | Mar-2016 | 56 |
| Oct 2015 | 32 | Jul-2016 | Mar-2016 | 56 |
| Nov 2015 | 35 | Jul-2016 | Mar-2016 | 56 |
| Dec 2015 | 4 | Jul-2016 | Mar-2016 | 56 |
| Jan 2016 | 345 | Jul-2016 | Mar-2016 | 56 |
| Feb 2016 | 25 | Jul-2016 | Mar-2016 | 56 |
| Mar 2016 | 56 | Jul-2016 | Mar-2016 | 56 |
| Apr 2016 | 78 | Jul-2016 | Jul-2016 | 45 |
| May 2016 | 657 | Jul-2016 | Jul-2016 | 45 |
| Jun 2016 | 45 | Jul-2016 | Jul-2016 | 45 |
| Jul 2016 | 45 | Jul-2016 | Jul-2016 | 45 |
- Mark as New
- Bookmark
- Subscribe
- Mute
- Subscribe to RSS Feed
- Permalink
- Report Inappropriate Content
Try this for Sales Output
=Aggr(FirstSortedValue(TOTAL <fiscalYear> Aggr(Sum(Sales), MonthYear), -MonthYear), MonthYear, fiscalYear)