Unlock a world of possibilities! Login now and discover the exclusive benefits awaiting you.
- Qlik Community
- :
- All Forums
- :
- QlikView App Dev
- :
- How to calculate YTD
- Subscribe to RSS Feed
- Mark Topic as New
- Mark Topic as Read
- Float this Topic for Current User
- Bookmark
- Subscribe
- Mute
- Printer Friendly Page
- Mark as New
- Bookmark
- Subscribe
- Mute
- Subscribe to RSS Feed
- Permalink
- Report Inappropriate Content
How to calculate YTD
Hi Guys,
I have a requirement that i need to calculate YTD for a data
Year To Date (YTD):
Dimensions: Year
I need to show all the Year
suppose if i click Year =2013 & Month= Jun , The chart has to show like sum(sales) from Jan to Jun for all the year
i.e.,
2013 = Jan to Jun
2012 = Jan to Jun
2011 = Jan to Jun
Attached the sample data
- « Previous Replies
-
- 1
- 2
- Next Replies »
- Mark as New
- Bookmark
- Subscribe
- Mute
- Subscribe to RSS Feed
- Permalink
- Report Inappropriate Content
Sunny,
your expression to working fine and view also as per my requirement
but only one thing is no change in previous years
i.e Suppose if i click Year = 2013 and Month= Apr
previous years also has to show from same month
As per your expression current year is changing perfectly but there is no change in value in previous year
- Mark as New
- Bookmark
- Subscribe
- Mute
- Subscribe to RSS Feed
- Permalink
- Report Inappropriate Content
I think it is changing...
What is the output you expect when you select 2013 and April?
Also, I have not used a new expression. It is the same one as the one that Manish gave.
- Mark as New
- Bookmark
- Subscribe
- Mute
- Subscribe to RSS Feed
- Permalink
- Report Inappropriate Content
No No sunny,
iam not saying about the formula
iam saying about view of bar chart
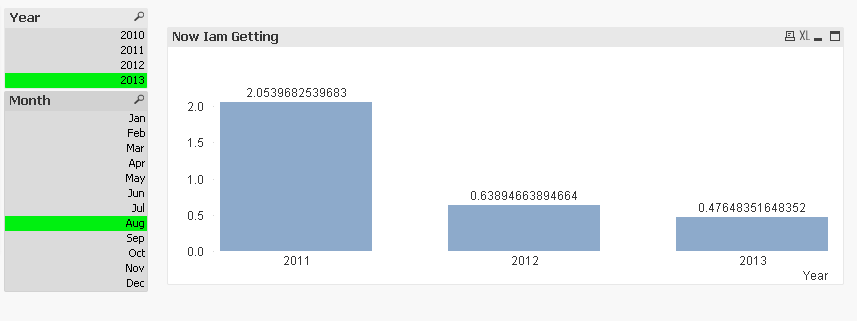
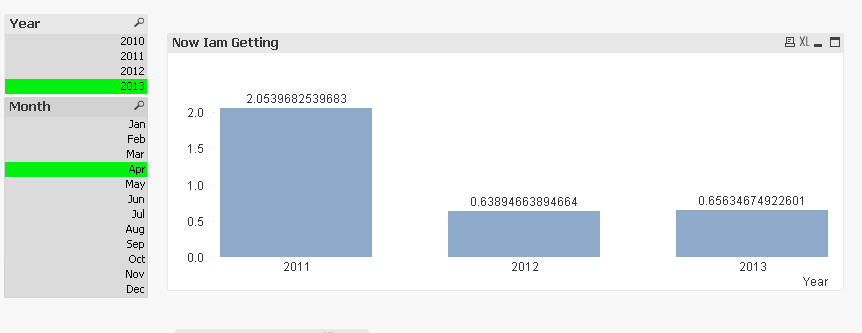
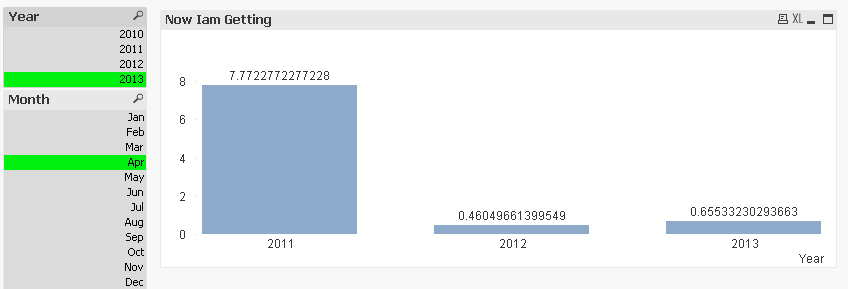
if i click on Year =2013 and month = Apr
in barchart:
2011(Jan- Apr) ,2012 (Jan- Apr), 2013(Jan - Apr) that means three bars has to come out in the chart
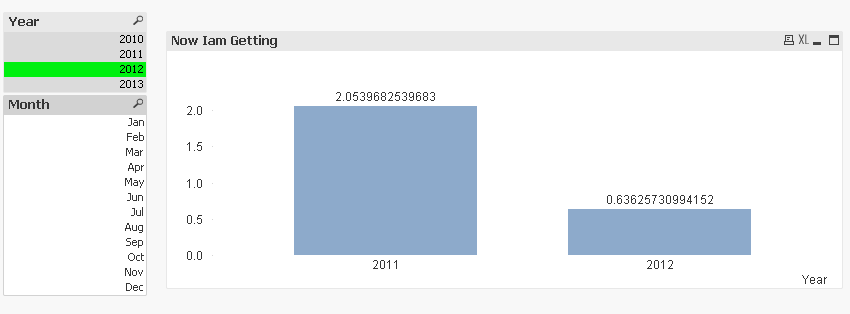
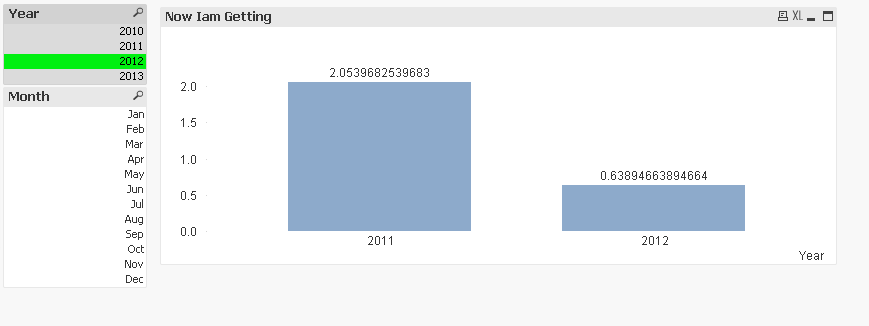
if i click on Year =2012 and month = Apr
in barchart :
2011(Jan- Apr) ,2012 (Jan- Apr), that means two bars has to come out in chart
- Mark as New
- Bookmark
- Subscribe
- Mute
- Subscribe to RSS Feed
- Permalink
- Report Inappropriate Content
Sunny
Please have a look on the attachment
In the chart the expression give required values but only one draw back is
if i click on Year =2012 In the bar chart 2013 also visible which i dnt want to show in bar chart
i.e,
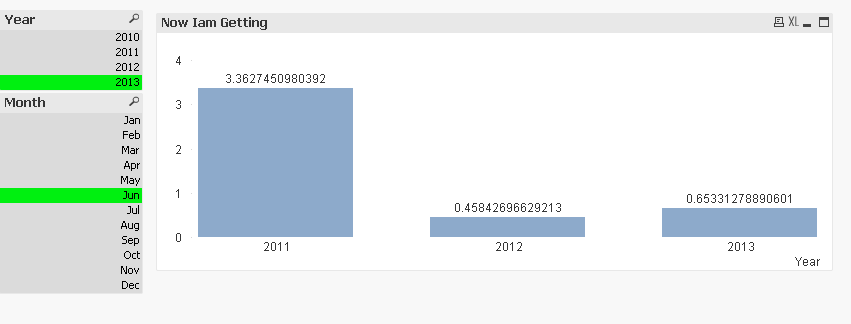
when click on year= 2013 and month =Jun
bars in the chart should
2013= jan to jun sum(sales)
2012 = jan to jun sum(sales)
2011= jan to jun sum(sales)
when click on year =2012 and month = jun
bar in the chart
2012 = jan to jun sum(sales)
2011= jan to jun sum(sales)
- Mark as New
- Bookmark
- Subscribe
- Mute
- Subscribe to RSS Feed
- Permalink
- Report Inappropriate Content
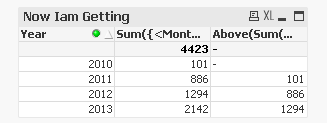
May be this?
(Sum({<Month, Year, YearMonth, MonthNum = {"$(='>=1<=' & Max(MonthNum))"}>}Sales)
/
Above(Sum({<Month, Year, YearMonth, MonthNum = {"$(='>=1<=' & Max(MonthNum))"}>}Sales)))-1
- Mark as New
- Bookmark
- Subscribe
- Mute
- Subscribe to RSS Feed
- Permalink
- Report Inappropriate Content
I that bar chart if u observe in the screen shot
1
 I think no sunny ,
in the First & Second screen shot 2011 & 2012 values are same which is to be not like that
My required r expect output is it has to change based on the selection month in all charts
As in Manish expression it is changing but only one thing when i select on 2012 but it still displaying the 2013 too
- Mark as New
- Bookmark
- Subscribe
- Mute
- Subscribe to RSS Feed
- Permalink
- Report Inappropriate Content
Where are you seeing this? In the file that i attached? I see this
- Mark as New
- Bookmark
- Subscribe
- Mute
- Subscribe to RSS Feed
- Permalink
- Report Inappropriate Content
Exactly Sunny ,
It is working fine
Thank you very much Sunny
Cheersss...!
- Mark as New
- Bookmark
- Subscribe
- Mute
- Subscribe to RSS Feed
- Permalink
- Report Inappropriate Content
Yeah I was a bit delay in finding the new attachment
when i was about to explain you a bit clear in that mean time you solved it and posted
Thanks Sunny,
- « Previous Replies
-
- 1
- 2
- Next Replies »