Unlock a world of possibilities! Login now and discover the exclusive benefits awaiting you.
- Qlik Community
- :
- All Forums
- :
- QlikView App Dev
- :
- How to calculate over a Range of Raw Data (Screen ...
- Subscribe to RSS Feed
- Mark Topic as New
- Mark Topic as Read
- Float this Topic for Current User
- Bookmark
- Subscribe
- Mute
- Printer Friendly Page
- Mark as New
- Bookmark
- Subscribe
- Mute
- Subscribe to RSS Feed
- Permalink
- Report Inappropriate Content
How to calculate over a Range of Raw Data (Screen attached)
Hi everyone ,
I am trying to calculate overall truncated average as shown in attached screenshot , Any help is highly appreciated.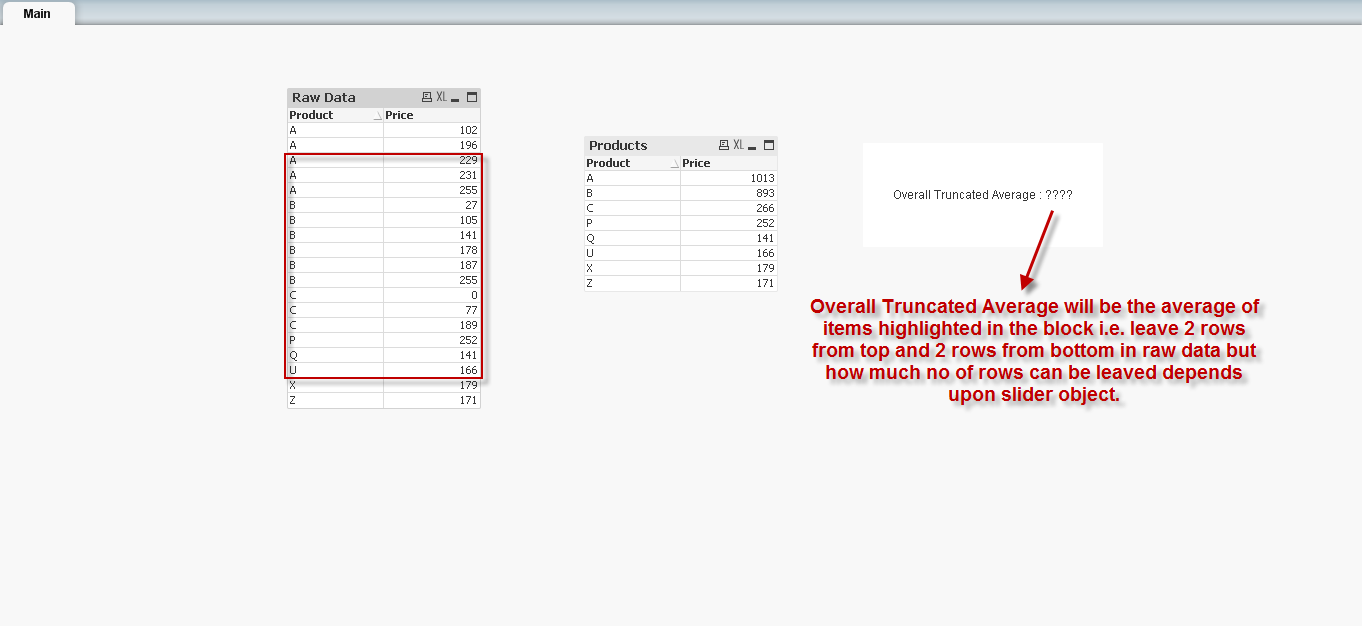
Thanks.
Regards,
Mubbasher Khaliq
- Mark as New
- Bookmark
- Subscribe
- Mute
- Subscribe to RSS Feed
- Permalink
- Report Inappropriate Content
Hi.
Assume that your case the set of rows is dynamic.
You could create a field that identify each row (product-price) so that two (or as much as set with a slider) lowest and two highest values correspond to the values that should be discarded.
Then you could use set analysis to discard that values from calculation.
Something like this:
=Avg({<ranking={">=$(=Min(total ranking)+2)<=$(=Max(total ranking)-2)"}>} Price)
- Mark as New
- Bookmark
- Subscribe
- Mute
- Subscribe to RSS Feed
- Permalink
- Report Inappropriate Content
Thanks for the response , It really helped me... but I am still having problem like I have created a field which displays row numbers but when I filter to product 'B,Q' then the row numbers will not be working with this expression as now I only want to consider rows of B and Q ... Is there any way to tackle this???
- Mark as New
- Bookmark
- Subscribe
- Mute
- Subscribe to RSS Feed
- Permalink
- Report Inappropriate Content
try RangeAvg() function.
- Mark as New
- Bookmark
- Subscribe
- Mute
- Subscribe to RSS Feed
- Permalink
- Report Inappropriate Content
Any Example ???
- Mark as New
- Bookmark
- Subscribe
- Mute
- Subscribe to RSS Feed
- Permalink
- Report Inappropriate Content
From help:
rangeavg(expr1 [ , expr2, ... exprN
])
Returns the average of a range of 1 to N arguments. If no numeric value is
found, NULL is returned.
The argument expressions of this function may contain Chart Inter Record Functions
with a third optional parameter, which in themselves return a range of values.
Examples:
| rangeavg (1,2,4) | returns 2.33333333 |
| rangeavg (1,'xyz') | returns 1 |
| rangeavg (null( ), 'abc') | returns NULL |
| rangeavg (above(count(x),0,3)) | returns a sliding average of the result of the inner count(x) expression calculated on the current row and two rows above the current row. |
- Mark as New
- Bookmark
- Subscribe
- Mute
- Subscribe to RSS Feed
- Permalink
- Report Inappropriate Content
Hmm... I think rank function can help in this case.
Assuming that you named the field 'rowno'.
You should check if the rank(rowno) is greater than 2 and smaller or equal to count(rowno)-2.
Avg({<rowno={'=rank(rowno)>2 and rank(rowno)<=count(rowno)-2'}>} Price)