Unlock a world of possibilities! Login now and discover the exclusive benefits awaiting you.
- Qlik Community
- :
- All Forums
- :
- QlikView App Dev
- :
- How to calculate the percentage of values in two r...
Options
- Subscribe to RSS Feed
- Mark Topic as New
- Mark Topic as Read
- Float this Topic for Current User
- Bookmark
- Subscribe
- Mute
- Printer Friendly Page
Turn on suggestions
Auto-suggest helps you quickly narrow down your search results by suggesting possible matches as you type.
Showing results for
Anonymous
Not applicable
2015-02-27
01:49 PM
- Mark as New
- Bookmark
- Subscribe
- Mute
- Subscribe to RSS Feed
- Permalink
- Report Inappropriate Content
How to calculate the percentage of values in two rows in a chart
Hi
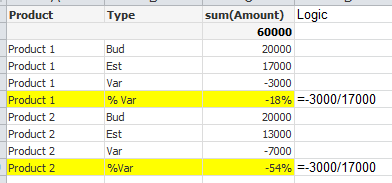
I have a chart look like this (chart 1). I want to add a row for % Var which equals to Var/Est. The final chart should like chart 2. Any idea how to do that?
chart 1
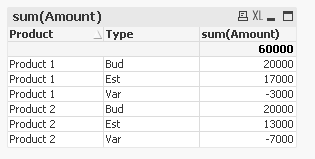
Chart 2
Thanks
Zixiao
993 Views
1 Solution
Accepted Solutions
MVP
2015-02-27
02:08 PM
- Mark as New
- Bookmark
- Subscribe
- Mute
- Subscribe to RSS Feed
- Permalink
- Report Inappropriate Content
857 Views
3 Replies
MVP
2015-02-27
02:08 PM
- Mark as New
- Bookmark
- Subscribe
- Mute
- Subscribe to RSS Feed
- Permalink
- Report Inappropriate Content
PFA
858 Views
Anonymous
Not applicable
2015-02-27
02:26 PM
Author
- Mark as New
- Bookmark
- Subscribe
- Mute
- Subscribe to RSS Feed
- Permalink
- Report Inappropriate Content
Thanks:)
827 Views
Contributor III
2015-02-27
02:32 PM
- Mark as New
- Bookmark
- Subscribe
- Mute
- Subscribe to RSS Feed
- Permalink
- Report Inappropriate Content
See attached. A slightly different version that calculates variance on the fly and displays differently.
Thanks Massimo for reminding me of Dimensionality() - I think that may be a better choice.
827 Views