Unlock a world of possibilities! Login now and discover the exclusive benefits awaiting you.
- Qlik Community
- :
- All Forums
- :
- QlikView App Dev
- :
- How to calculate time spent by user on each Dashbo...
- Subscribe to RSS Feed
- Mark Topic as New
- Mark Topic as Read
- Float this Topic for Current User
- Bookmark
- Subscribe
- Mute
- Printer Friendly Page
- Mark as New
- Bookmark
- Subscribe
- Mute
- Subscribe to RSS Feed
- Permalink
- Report Inappropriate Content
How to calculate time spent by user on each Dashboard & Sheet
Hi,
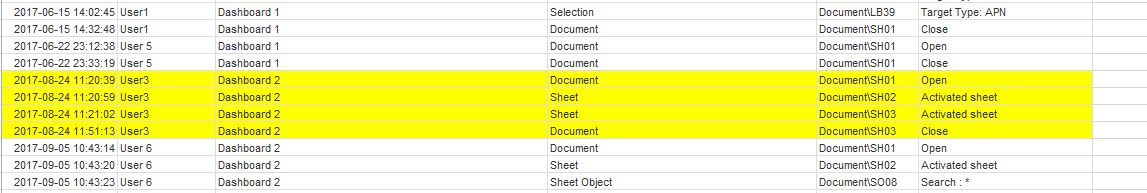
I am trying to calculate, how much time a user has spent on each dashboard and sheet.
Example: In the below image, i want to calculate time spent (in minutes) by user 3 on dashboard 2 and also time spent in minutes on SH01, SH02 and SH03.
The above example is just for one user. However I want to calculate for all the users. Please help me.
Please find the data attached. youssefbelloum
- Mark as New
- Bookmark
- Subscribe
- Mute
- Subscribe to RSS Feed
- Permalink
- Report Inappropriate Content
You should be, you might just need to force the sort order to be the opposite using Aggr() function. But why do you want to use Above()
- Mark as New
- Bookmark
- Subscribe
- Mute
- Subscribe to RSS Feed
- Permalink
- Report Inappropriate Content
Because I Found correct result with above, I thought i can add the aggregation function with a sum and it will work, but no, it needs to be with the opposite sorting.. I don't understand why
- Mark as New
- Bookmark
- Subscribe
- Mute
- Subscribe to RSS Feed
- Permalink
- Report Inappropriate Content
So there is a difference between Above and Below version of the expressions
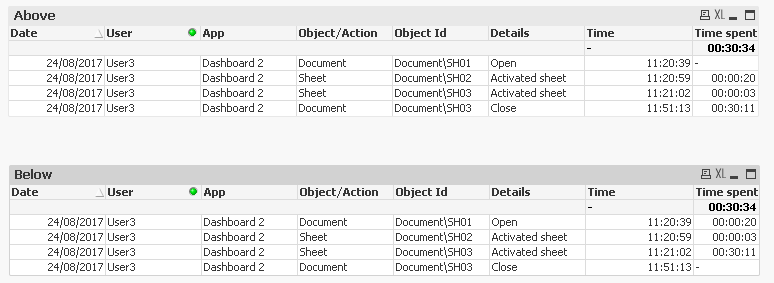
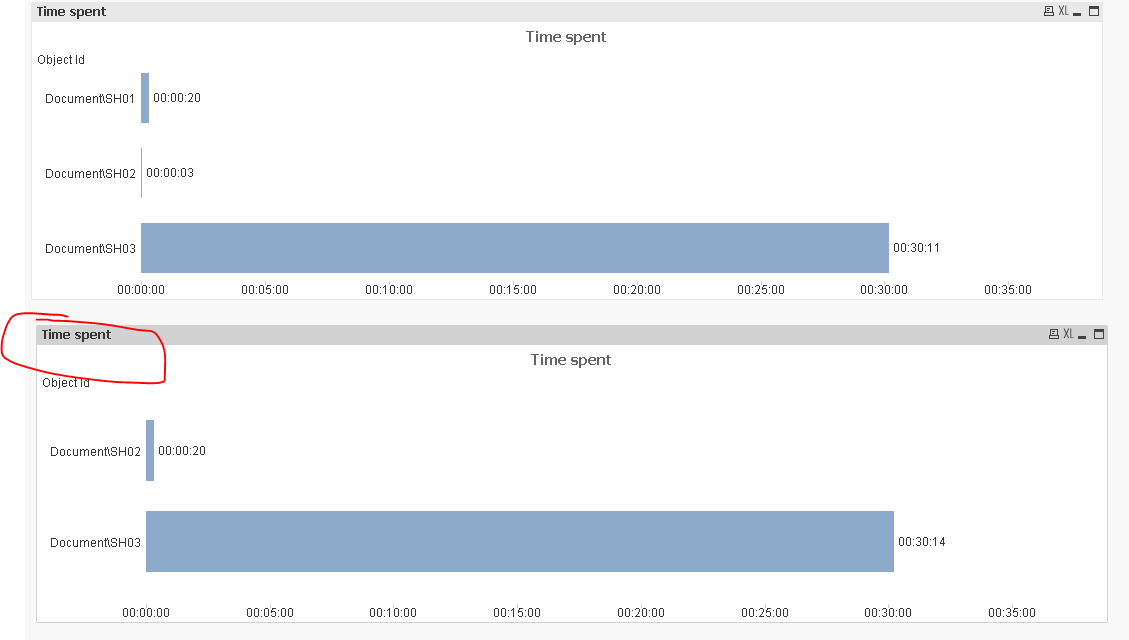
Above is saying that User 3 spent no time on SH01, whereas Below says that User 3 spent 20 seconds before we moved to SH02. Which one do you think makes more sense? If you open the dashboard with SH01, you would at least spend 1 second before you go elsewhere. Also, Above is saying that 30 mins were spent on the last step. I think because last step is just close, the time spent on SH03 is calculated on Row3, Row4 is just to say that now the dashboard was closed so no time needed for the row where the dashboard was closed. Does this make sense?
- Mark as New
- Bookmark
- Subscribe
- Mute
- Subscribe to RSS Feed
- Permalink
- Report Inappropriate Content
Here is what I think you should do..
Script
table:
LOAD Timestamp,
Date(Timestamp) as Date,
User,
App,
[Object/Action],
[Object Id],
Details,
[Object Id]&Timestamp as Key
FROM
[Time123.xlsx]
(ooxml, embedded labels, table is Sheet1);
Chart
Dimension
Object Id
Expression
=Sum(Aggr(Below(Timestamp) - Timestamp, User, Key))
- Mark as New
- Bookmark
- Subscribe
- Mute
- Subscribe to RSS Feed
- Permalink
- Report Inappropriate Content
I see what you're saying
I was thinking that we can calculate spent time only with the line coming next, to do the substraction.
actually, with above, you can see how much time the user spent on SH01 on the second line, which makes more sense if you can read it on the same line.
what i cannot understand is why i should modify the sorting with above (I'm asking just because i have nothing displayed on the barchart with above, now I know that i will have incorrect values)
- Mark as New
- Bookmark
- Subscribe
- Mute
- Subscribe to RSS Feed
- Permalink
- Report Inappropriate Content
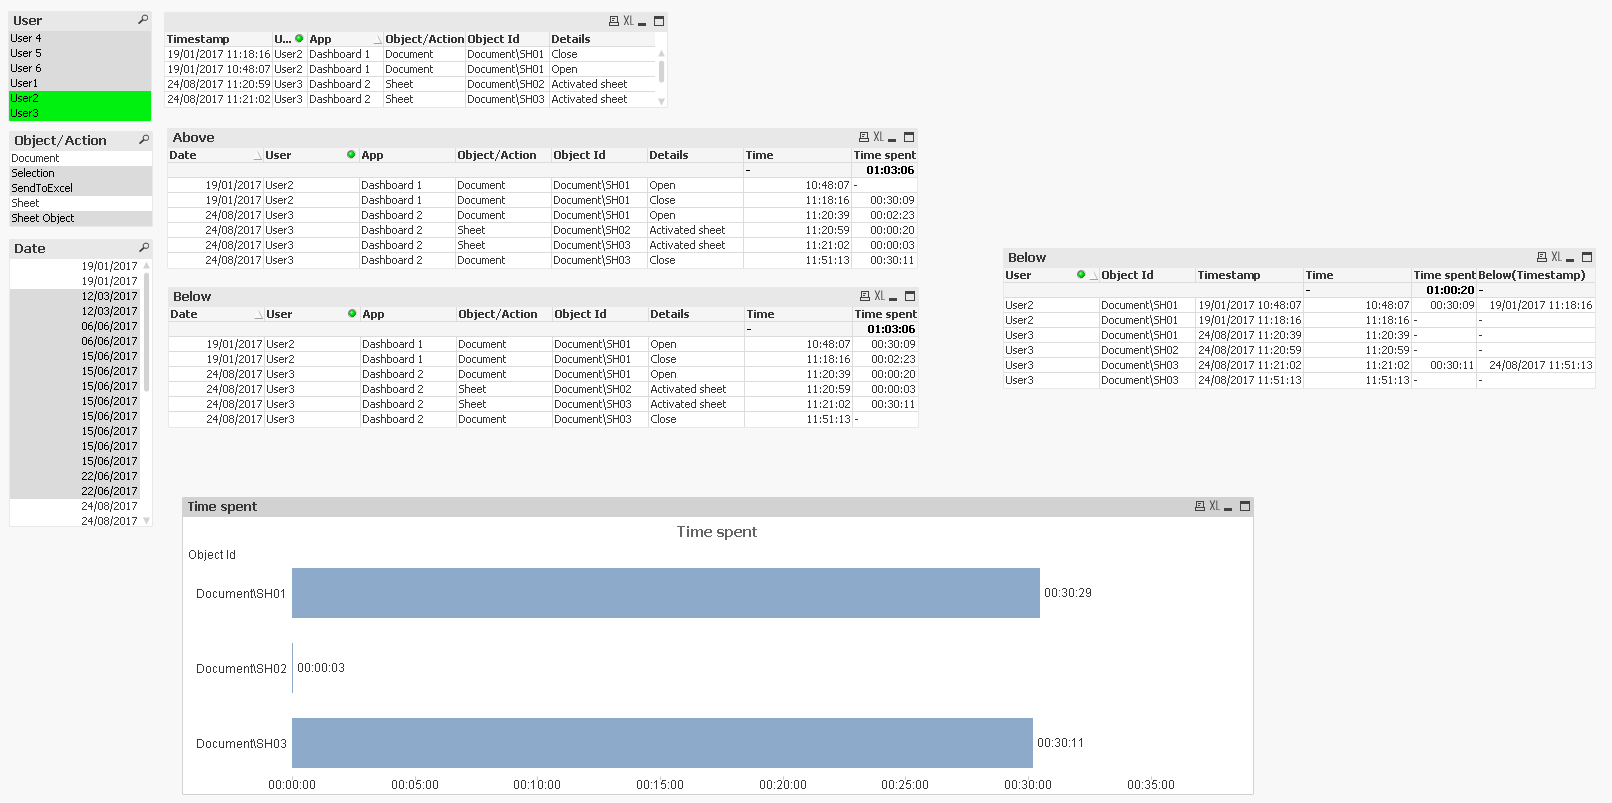
It should work....
I did post an image above
We see two bars because SH01 is null and SH03 is grouped together into one single bar. 30 mins and 11 seconds + 3 seconds
- Mark as New
- Bookmark
- Subscribe
- Mute
- Subscribe to RSS Feed
- Permalink
- Report Inappropriate Content
What is the expression you used please ?
- Mark as New
- Bookmark
- Subscribe
- Mute
- Subscribe to RSS Feed
- Permalink
- Report Inappropriate Content
This
=Sum(Aggr(Timestamp - Above(TOTAL Timestamp), Date, User, App, [Object/Action], [Object Id], Details))
- Mark as New
- Bookmark
- Subscribe
- Mute
- Subscribe to RSS Feed
- Permalink
- Report Inappropriate Content
It was the only() function that creates the problem..
Thank you for your time Sunny !
- Mark as New
- Bookmark
- Subscribe
- Mute
- Subscribe to RSS Feed
- Permalink
- Report Inappropriate Content
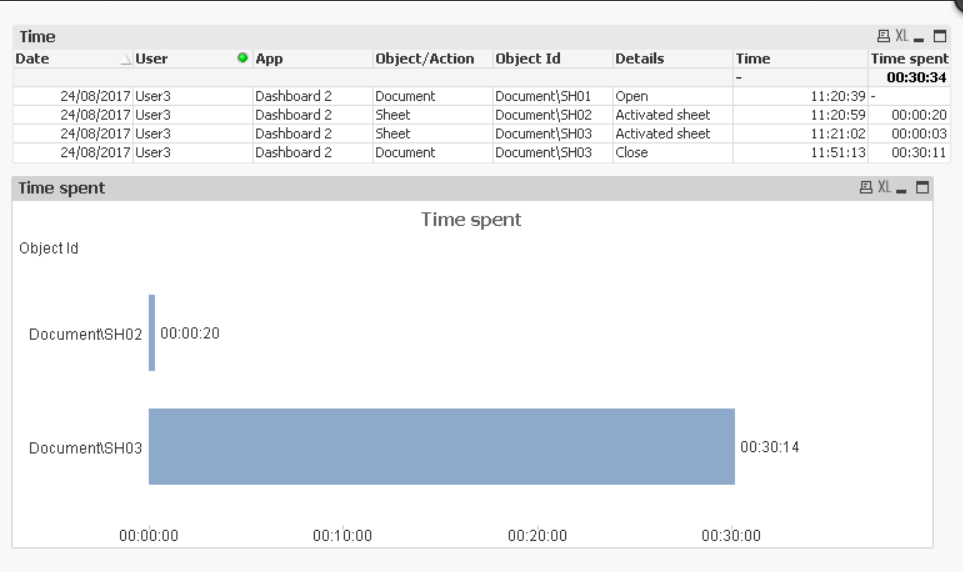
Hi Sunny,
Thanks for your efforts. Actually i want the total time spent on sheets(considering the sheet objects). Currently total time spent on SH01 is showing 23:13:54. but in the data it doestnt sums upto 23 hours. Approximately it is summing upto 3 or 4 hours. Please let me know if i am missing anything.