Unlock a world of possibilities! Login now and discover the exclusive benefits awaiting you.
- Qlik Community
- :
- All Forums
- :
- QlikView App Dev
- :
- How to chage the colour of guage chart based on co...
Options
- Subscribe to RSS Feed
- Mark Topic as New
- Mark Topic as Read
- Float this Topic for Current User
- Bookmark
- Subscribe
- Mute
- Printer Friendly Page
Turn on suggestions
Auto-suggest helps you quickly narrow down your search results by suggesting possible matches as you type.
Showing results for
Not applicable
2014-06-27
04:27 AM
- Mark as New
- Bookmark
- Subscribe
- Mute
- Subscribe to RSS Feed
- Permalink
- Report Inappropriate Content
How to chage the colour of guage chart based on condition?
Hi,
I have a gauge chart with below expression:
Avg(CaseStats)
the value of Avg(CaseStats) has 243. I have to write a condition to show the values as in green colour if Average <90 it should show green and the values above 90 should show Red
how can I change the expression can anyone help me please?
Thanks.
- Tags:
- new_to_qlikview
2,034 Views
- « Previous Replies
-
- 1
- 2
- Next Replies »
15 Replies
Champion II
2014-06-27
05:12 AM
- Mark as New
- Bookmark
- Subscribe
- Mute
- Subscribe to RSS Feed
- Permalink
- Report Inappropriate Content
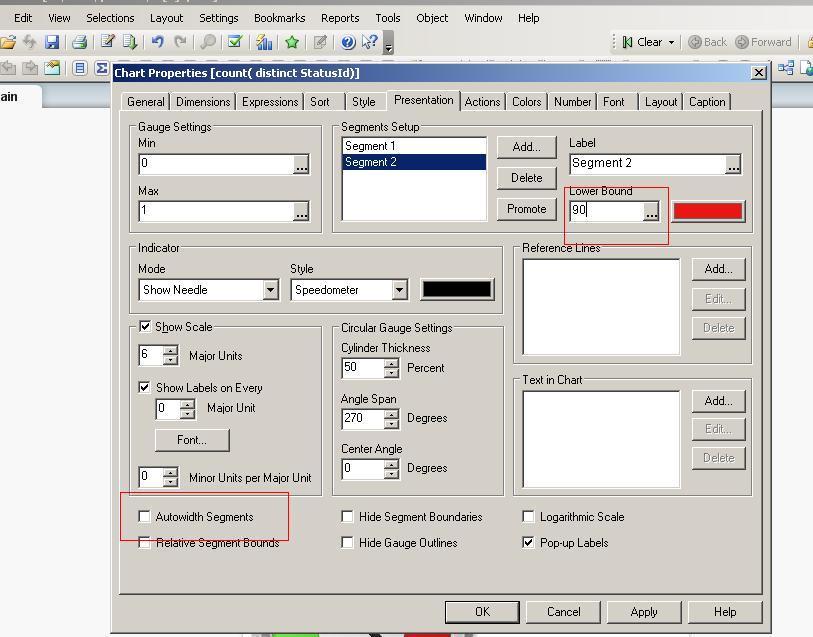
uncheck autowidth segment at bottom left and then change.
Sunil Chauhan
421 Views
Not applicable
2014-06-27
05:14 AM
Author
- Mark as New
- Bookmark
- Subscribe
- Mute
- Subscribe to RSS Feed
- Permalink
- Report Inappropriate Content
Thanks. which values I need to pass in min and max? because when I am giving min=0 and max=1 it is showing all green
421 Views
Champion II
2014-06-27
05:14 AM
- Mark as New
- Bookmark
- Subscribe
- Mute
- Subscribe to RSS Feed
- Permalink
- Report Inappropriate Content
Sunil Chauhan
421 Views
Anonymous
Not applicable
2014-06-27
05:42 AM
Author
- Mark as New
- Bookmark
- Subscribe
- Mute
- Subscribe to RSS Feed
- Permalink
- Report Inappropriate Content
Hi,
min=0 and max=Avg(CaseStats)
421 Views
Master III
2014-06-27
05:54 AM
- Mark as New
- Bookmark
- Subscribe
- Mute
- Subscribe to RSS Feed
- Permalink
- Report Inappropriate Content
Hi Amelia,
Please see the attachment and check presentation tan under chart properties.
Thanks,
AS
Not applicable
2014-06-27
10:32 AM
Author
- Mark as New
- Bookmark
- Subscribe
- Mute
- Subscribe to RSS Feed
- Permalink
- Report Inappropriate Content
Thanks for all.
421 Views
- « Previous Replies
-
- 1
- 2
- Next Replies »