Unlock a world of possibilities! Login now and discover the exclusive benefits awaiting you.
- Qlik Community
- :
- All Forums
- :
- QlikView App Dev
- :
- How to change the colour of the Bars based on % of...
- Subscribe to RSS Feed
- Mark Topic as New
- Mark Topic as Read
- Float this Topic for Current User
- Bookmark
- Subscribe
- Mute
- Printer Friendly Page
- Mark as New
- Bookmark
- Subscribe
- Mute
- Subscribe to RSS Feed
- Permalink
- Report Inappropriate Content
How to change the colour of the Bars based on % of Fail?
Hi,
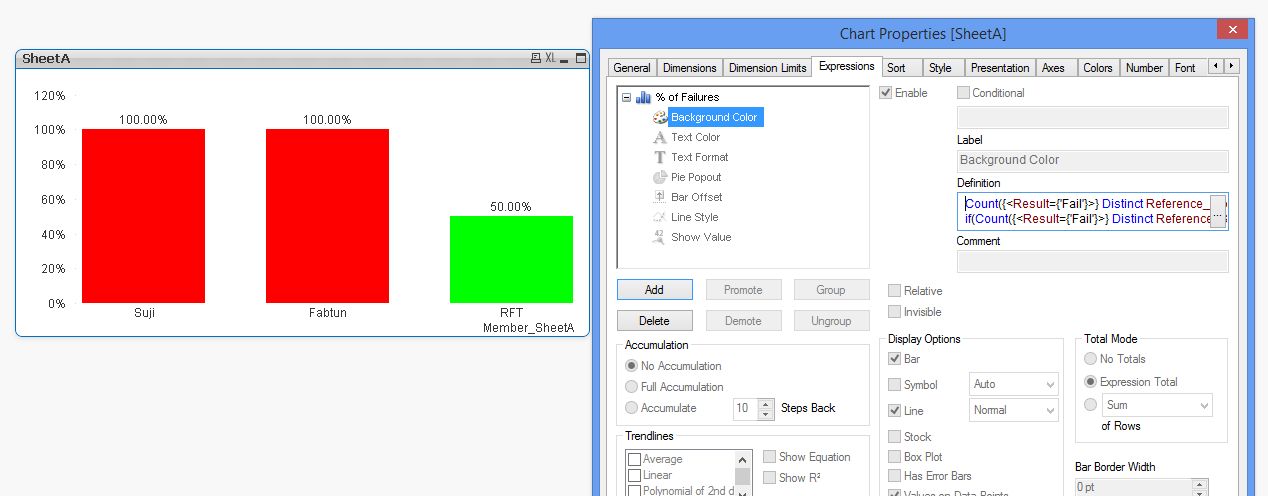
I have bar chart with
Dimension: Member_SheetA
Expression: Count({<Result={'Fail'}>} Distinct Reference_SheetA)/Count(Distinct(Reference_SheetA))
Show the chart will show the % of Fail items for each Member
Is it possible to change the color of the bars i,e if the Member fails 100% it should show in RED, if the Member fails 50 % it should show in Green , if Member fails less than 40 % it should show in Blue and so on?
Please can anyone suggest me.
Thanks in advance.
- Tags:
- new_to_qlikview
Accepted Solutions
- Mark as New
- Bookmark
- Subscribe
- Mute
- Subscribe to RSS Feed
- Permalink
- Report Inappropriate Content
GO TO Expression
Click on + sign
Type below in Background Color expression
=IF(Column(1)='100%',RED(),
IF(Column(1)<='50%',GREEN(),
IF(Column(1)<='40%',BLUE())))
- Mark as New
- Bookmark
- Subscribe
- Mute
- Subscribe to RSS Feed
- Permalink
- Report Inappropriate Content
Please find attached.
- Mark as New
- Bookmark
- Subscribe
- Mute
- Subscribe to RSS Feed
- Permalink
- Report Inappropriate Content
- Mark as New
- Bookmark
- Subscribe
- Mute
- Subscribe to RSS Feed
- Permalink
- Report Inappropriate Content
Hi Amelia,
use this expression for the background color of your expression:
If(
Count({<Result={'Fail'}>} Distinct Reference_SheetA)/Count(Distinct(Reference_SheetA)) > 0.5, LightRed(),
if(Count({<Result={'Fail'}>} Distinct Reference_SheetA)/Count(Distinct(Reference_SheetA))<= 0.5, LightGreen(), LightBlue())
)
Hope this is ok for you
Burkhard
- Mark as New
- Bookmark
- Subscribe
- Mute
- Subscribe to RSS Feed
- Permalink
- Report Inappropriate Content
Put in the Background colour of your expression:
=if(Count({<Result={'Fail'}>} Distinct Reference_SheetA)/Count(Distinct(Reference_SheetA))<=.50,Green(),Red())
In this case, if your target is less than or equal to 50%, the bar is Green, otherwise it's Red. Use as many nested IFs to cover your boundaries.
- Mark as New
- Bookmark
- Subscribe
- Mute
- Subscribe to RSS Feed
- Permalink
- Report Inappropriate Content
GO TO Expression
Click on + sign
Type below in Background Color expression
=IF(Column(1)='100%',RED(),
IF(Column(1)<='50%',GREEN(),
IF(Column(1)<='40%',BLUE())))
- Mark as New
- Bookmark
- Subscribe
- Mute
- Subscribe to RSS Feed
- Permalink
- Report Inappropriate Content
if I understand you can
put the color expression in background color (adapt color to your need)
if(Count({<Result={'Fail'}>} Distinct Reference_SheetA)/Count(Distinct(Reference_SheetA))=1, rgb(255,0,0),
if(Count({<Result={'Fail'}>} Distinct Reference_SheetA)/Count(Distinct(Reference_SheetA))>=0.5, rgb(0,255,0),
if(Count({<Result={'Fail'}>} Distinct Reference_SheetA)/Count(Distinct(Reference_SheetA))>=0.4, rgb(0,0,255),
rgb(0,0,0))))
or use colormix wizard
- Mark as New
- Bookmark
- Subscribe
- Mute
- Subscribe to RSS Feed
- Permalink
- Report Inappropriate Content
Thanks. Perfect