Unlock a world of possibilities! Login now and discover the exclusive benefits awaiting you.
- Qlik Community
- :
- All Forums
- :
- QlikView App Dev
- :
- How to consider only Maximum month data in all yea...
- Subscribe to RSS Feed
- Mark Topic as New
- Mark Topic as Read
- Float this Topic for Current User
- Bookmark
- Subscribe
- Mute
- Printer Friendly Page
- Mark as New
- Bookmark
- Subscribe
- Mute
- Subscribe to RSS Feed
- Permalink
- Report Inappropriate Content
How to consider only Maximum month data in all years in bar chart , here Year as Dimension
Hello All,
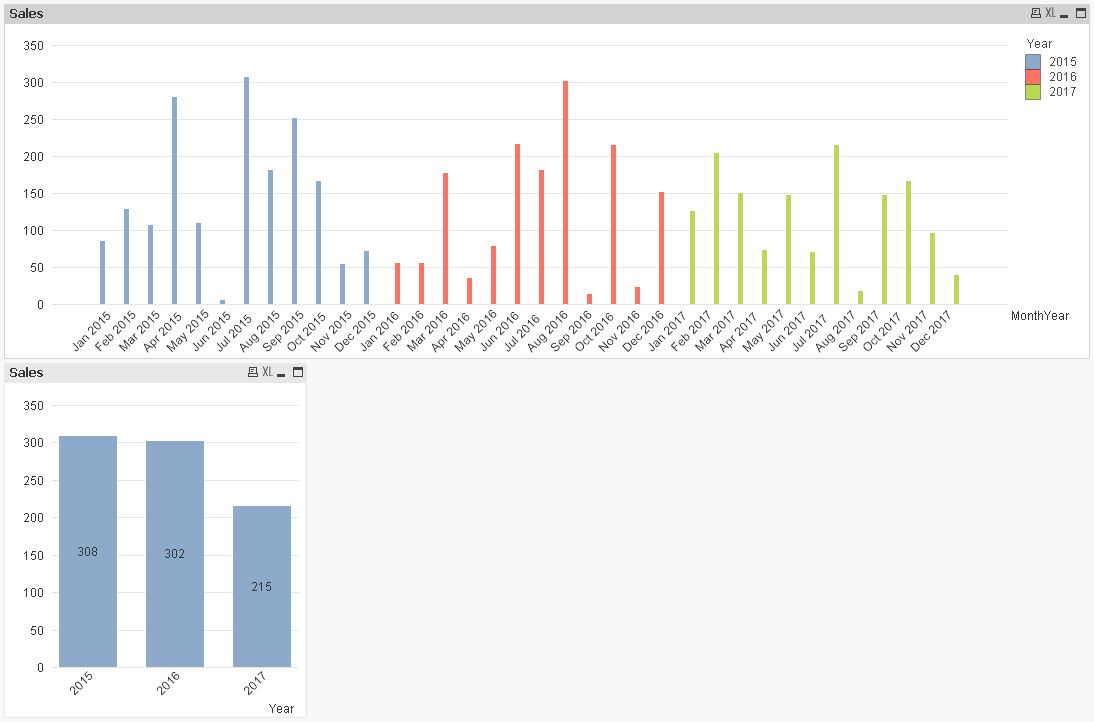
I have taken Dimension as Year and Expression as Sum(sales). Here i have to consider Maximum month data in all years in bar chart like attached image.
Ex: 2015 => December data
2016 ==> December Data
2017 ==> July Data only
Accepted Solutions
- Mark as New
- Bookmark
- Subscribe
- Mute
- Subscribe to RSS Feed
- Permalink
- Report Inappropriate Content
Hi Tulasiram,
Create a master calendar with (Year, Month, MonthNo, etc)
MonthNo is month number i.e 6: Jun; 7: Jul
Dimension:
Year
Use below set Analysis in expression:
=Sum({<Year,MonthNo={'$(=Max(MonthNo))'},Quarter,week,Date>}Sales)
Regards,
Pankaj
- Mark as New
- Bookmark
- Subscribe
- Mute
- Subscribe to RSS Feed
- Permalink
- Report Inappropriate Content
Hi,
1 exam
Aggr(IF(Rank(SUM(sales))= 1, SUM(sales)),year,month)
- Mark as New
- Bookmark
- Subscribe
- Mute
- Subscribe to RSS Feed
- Permalink
- Report Inappropriate Content
Hi,
one solution could be also:
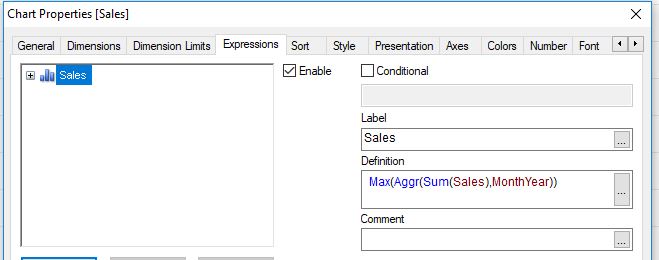
Max(Aggr(Sum(Sales),MonthYear))
table1:
LOAD *,
    Year(MonthYear) as Year;
LOAD RecNo() as ID,
    MonthName(MakeDate(2015),Floor(Rand()*36)) as MonthYear,
    Ceil(Rand()*100) as Sales
AutoGenerate 100;
hope this helps
regards
Marco
- Mark as New
- Bookmark
- Subscribe
- Mute
- Subscribe to RSS Feed
- Permalink
- Report Inappropriate Content
Hello,
Maybe:
Max(Aggr(Sum(Sales),Month,Year))
Cheers
Andrew
- Mark as New
- Bookmark
- Subscribe
- Mute
- Subscribe to RSS Feed
- Permalink
- Report Inappropriate Content
Hi Tulasiram,
Create a master calendar with (Year, Month, MonthNo, etc)
MonthNo is month number i.e 6: Jun; 7: Jul
Dimension:
Year
Use below set Analysis in expression:
=Sum({<Year,MonthNo={'$(=Max(MonthNo))'},Quarter,week,Date>}Sales)
Regards,
Pankaj