Unlock a world of possibilities! Login now and discover the exclusive benefits awaiting you.
- Qlik Community
- :
- All Forums
- :
- QlikView App Dev
- :
- How to correctly use Mid function in set expressio...
- Subscribe to RSS Feed
- Mark Topic as New
- Mark Topic as Read
- Float this Topic for Current User
- Bookmark
- Subscribe
- Mute
- Printer Friendly Page
- Mark as New
- Bookmark
- Subscribe
- Mute
- Subscribe to RSS Feed
- Permalink
- Report Inappropriate Content
How to correctly use Mid function in set expression
Hi All,
I have a requirement where i need to extract the month/period part from a key containing year-month-week.
This needs to be done in a chart which has to show all records irrespective of any period/week selection.
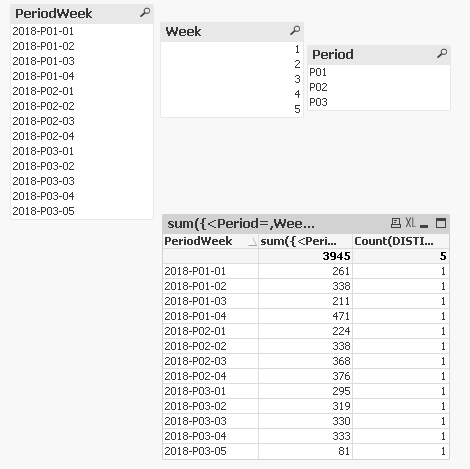
In the attached file, i am using the following expression to count the number of weeks in the corresponding period in chart:
count({<Period={"=mid(PeriodWeek,6,3)"}>}distinct Week), however it is always returning 0.
Please suggest the correct usage.
Thanks,
Reema
- Mark as New
- Bookmark
- Subscribe
- Mute
- Subscribe to RSS Feed
- Permalink
- Report Inappropriate Content
Since you are looking to evaluate the condition on row by row basis, set analysis in not going to work for you.... You will either need to create a flag in the script or use an if statement to do this
Count(DISTINCT If(Period = Mid(PeriodWeek,6,3), Week))
- Mark as New
- Bookmark
- Subscribe
- Mute
- Subscribe to RSS Feed
- Permalink
- Report Inappropriate Content
Thanks, however I need to display count of weeks as total number of weeks in that period, for eg. all rows with P01 should display 4 and P03 should display 5.
I tried disregarding the dimension with the following, it is not working:
Count({<Week=,Period=,PeriodWeek=>}DISTINCT If(Period = Mid(PeriodWeek,6,3), Week))
- Mark as New
- Bookmark
- Subscribe
- Mute
- Subscribe to RSS Feed
- Permalink
- Report Inappropriate Content
This?
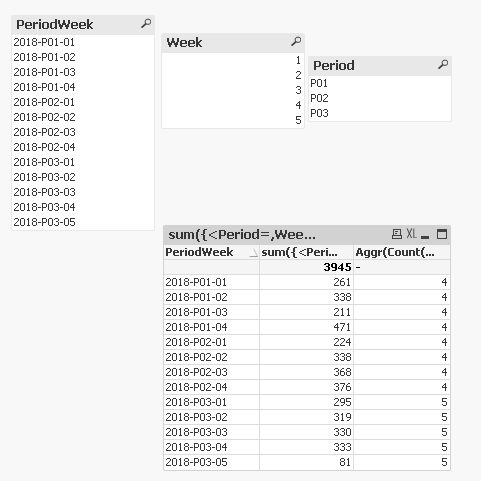
Aggr(Count(TOTAL <Period>DISTINCT If(Period = Mid(PeriodWeek,6,3), Week)), PeriodWeek, Period)