Unlock a world of possibilities! Login now and discover the exclusive benefits awaiting you.
- Qlik Community
- :
- All Forums
- :
- QlikView App Dev
- :
- How to count rows from conditional chart table fie...
- Subscribe to RSS Feed
- Mark Topic as New
- Mark Topic as Read
- Float this Topic for Current User
- Bookmark
- Subscribe
- Mute
- Printer Friendly Page
- Mark as New
- Bookmark
- Subscribe
- Mute
- Subscribe to RSS Feed
- Permalink
- Report Inappropriate Content
How to count rows from conditional chart table fields in text object
Hello All,
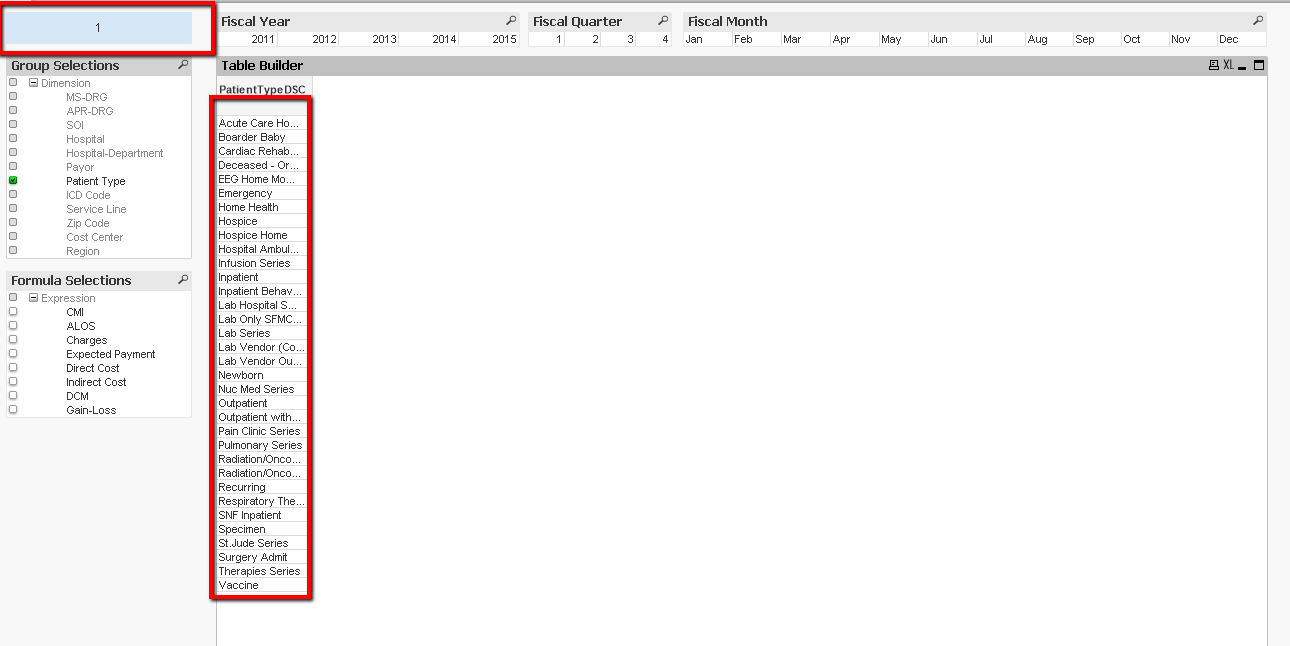
I am wondering how do I count the number of rows in a text object based on a selected conditional dimension in a chart table? As you can see below, I would like the count of rows to display in that text box. The conditional dimensions are controlled by the list boxes on the left. This allows the user to build a custom table of data to then export to excel. This whole point of this is to warn the user when the selections are reach 1 million rows, so they do not export to much data to excel.

Accepted Solutions
- Mark as New
- Bookmark
- Subscribe
- Mute
- Subscribe to RSS Feed
- Permalink
- Report Inappropriate Content
Do you have any field names containing spaces (or other special characters)? If so, try =sum(aggr(1, $(=concat('[' & %Dimension & ']', ',' ))))
Can you post a qlikview document that demonstrates the problem?
talk is cheap, supply exceeds demand
- Mark as New
- Bookmark
- Subscribe
- Mute
- Subscribe to RSS Feed
- Permalink
- Report Inappropriate Content
See attached example for an approach that usually gives a reasonable estimation. The result can be higher than the number of rows in the chart because of zero/null suppression and reduced sets resulting from set analysis expressions.
talk is cheap, supply exceeds demand
- Mark as New
- Bookmark
- Subscribe
- Mute
- Subscribe to RSS Feed
- Permalink
- Report Inappropriate Content
Hey,
I put the code below in my text object. I am just getting a zero.
=sum(aggr(1, $(=concat(%Dimension, ',' ))))
This is the formula I use for the conditional dimensions/expressions to appear when the user selects them.
SubStringCount(Concat(%Dimension, '|'), 'Hospital') and GetSelectedCount(%Dimension) > 0
- Mark as New
- Bookmark
- Subscribe
- Mute
- Subscribe to RSS Feed
- Permalink
- Report Inappropriate Content
Do you have any field names containing spaces (or other special characters)? If so, try =sum(aggr(1, $(=concat('[' & %Dimension & ']', ',' ))))
Can you post a qlikview document that demonstrates the problem?
talk is cheap, supply exceeds demand
- Mark as New
- Bookmark
- Subscribe
- Mute
- Subscribe to RSS Feed
- Permalink
- Report Inappropriate Content
Gysbert,
I am using sum(aggr(1, $(=concat(_dimension, ',' )))) to count the lines in my Ad Hoc table but the numbers don't match. It gives me 335, for example, but only exports 152. Any thoughts without me posting a sample?
Thanks,
Cassandra