Unlock a world of possibilities! Login now and discover the exclusive benefits awaiting you.
- Qlik Community
- :
- All Forums
- :
- QlikView App Dev
- :
- How to count the total of each value from a field?
- Subscribe to RSS Feed
- Mark Topic as New
- Mark Topic as Read
- Float this Topic for Current User
- Bookmark
- Subscribe
- Mute
- Printer Friendly Page
- Mark as New
- Bookmark
- Subscribe
- Mute
- Subscribe to RSS Feed
- Permalink
- Report Inappropriate Content
How to count the total of each value from a field?
Hello everyone,
I am creating a bar chart which displays the percentage of Red and Green from each Area, as you can see below:
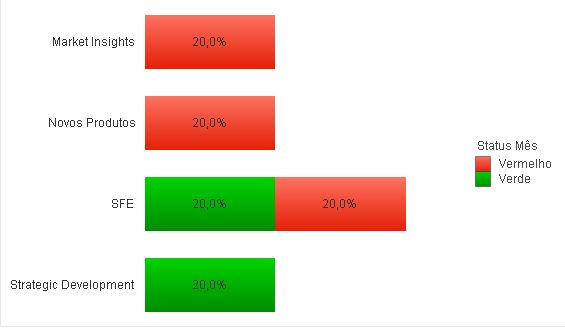
The chart show the total percentage considering all areas, but i would like to display the total percentage of each area.
For example, in this case, "Market Insights" should be 100% Red, and "SFE" should be 50% Green and 50% Red.
I tryed to use Count Distinct, but was not enought:
Count (DISTINCT [Status Month])
Please, can someone help me on this?
- Tags:
- new_to_qlikview
Accepted Solutions
- Mark as New
- Bookmark
- Subscribe
- Mute
- Subscribe to RSS Feed
- Permalink
- Report Inappropriate Content
You must be using the checkbox "Relative", correct?
Instead, divide each count by the total count by Area, like this:
Count (DISTINCT [Status Month]) / Count (DISTINCT TOTAL <Area> [Status Month])
Check out my new book "QlikView Your Business" - you will learn how to develop the most complex calculations in QlikView and Qlik Sense.
cheers,
Oleg Troyansky
QlikView Your Business: An expert guide to Business Discovery with QlikView and Qlik Sense
- Mark as New
- Bookmark
- Subscribe
- Mute
- Subscribe to RSS Feed
- Permalink
- Report Inappropriate Content
Hi Rodrigo Caldas,
Can you give us a sample code so that we can take a look?
Thanks,
Miguel
- Mark as New
- Bookmark
- Subscribe
- Mute
- Subscribe to RSS Feed
- Permalink
- Report Inappropriate Content
You must be using the checkbox "Relative", correct?
Instead, divide each count by the total count by Area, like this:
Count (DISTINCT [Status Month]) / Count (DISTINCT TOTAL <Area> [Status Month])
Check out my new book "QlikView Your Business" - you will learn how to develop the most complex calculations in QlikView and Qlik Sense.
cheers,
Oleg Troyansky
QlikView Your Business: An expert guide to Business Discovery with QlikView and Qlik Sense
- Mark as New
- Bookmark
- Subscribe
- Mute
- Subscribe to RSS Feed
- Permalink
- Report Inappropriate Content
Thanks Oleg.