Unlock a world of possibilities! Login now and discover the exclusive benefits awaiting you.
- Qlik Community
- :
- All Forums
- :
- QlikView App Dev
- :
- How to create a 4bars stacked bar chart with 1 dim...
- Subscribe to RSS Feed
- Mark Topic as New
- Mark Topic as Read
- Float this Topic for Current User
- Bookmark
- Subscribe
- Mute
- Printer Friendly Page
- Mark as New
- Bookmark
- Subscribe
- Mute
- Subscribe to RSS Feed
- Permalink
- Report Inappropriate Content
How to create a 4bars stacked bar chart with 1 dimension and 8 expressions?
Hi all,
I have year as the dimension and 8 expressions(4 years of sales from 1 table and 4 years of outlook from another table) in a bar chart.
I want a stacked bar chart as below, 2012 sales and outlook stacked, 2013 sales and outlook stacked,2014 sales and outlook stacked & 2015 sales and outlook stacked.
Note: Ignore the years in the above image.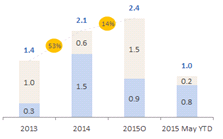
Can someone please help me with this.
Thanks!
- Tags:
- new_to_qlikview
- Mark as New
- Bookmark
- Subscribe
- Mute
- Subscribe to RSS Feed
- Permalink
- Report Inappropriate Content
I think you need a common dimension Year and only two expressions, one for sales and one for outlook.
You could consider concatenating both tables in your data model to achieve this.
Could you post some sample lines of data?
- Mark as New
- Bookmark
- Subscribe
- Mute
- Subscribe to RSS Feed
- Permalink
- Report Inappropriate Content
your years will be dynamic, so you may have 4 now, but will have at least 5 next year, I would think and it would conintue to grow over time. You should only needy 2 expressions, and they will get applied across the dimensions
the 2 expressions would be sales and outlook. On the style tab, select stacked to get the look you are expecting