Unlock a world of possibilities! Login now and discover the exclusive benefits awaiting you.
- Qlik Community
- :
- All Forums
- :
- QlikView App Dev
- :
- How to create dimension to show the range
- Subscribe to RSS Feed
- Mark Topic as New
- Mark Topic as Read
- Float this Topic for Current User
- Bookmark
- Subscribe
- Mute
- Printer Friendly Page
- Mark as New
- Bookmark
- Subscribe
- Mute
- Subscribe to RSS Feed
- Permalink
- Report Inappropriate Content
How to create dimension to show the range
Hello Everyone,
I have below scenario:
I have attendee count and expenses, both are measures.
I need to create a chart having range as a dimension, means from 0-10 attendees what is the sum(expenses), for 10-20 what is the sum like that till 90-100.
in x axis i need to show 0-10 to 90-100 values, this one i need to calculate from count
any suggestions please
Thanks in advance
Regards,
Sreeharsha V
- « Previous Replies
- Next Replies »
Accepted Solutions
- Mark as New
- Bookmark
- Subscribe
- Mute
- Subscribe to RSS Feed
- Permalink
- Report Inappropriate Content
like this
- Mark as New
- Bookmark
- Subscribe
- Mute
- Subscribe to RSS Feed
- Permalink
- Report Inappropriate Content
Can you post the sample data?
Create ranges and use interval match.
- Mark as New
- Bookmark
- Subscribe
- Mute
- Subscribe to RSS Feed
- Permalink
- Report Inappropriate Content
Use Class function for this.
Regards
Anand
- Mark as New
- Bookmark
- Subscribe
- Mute
- Subscribe to RSS Feed
- Permalink
- Report Inappropriate Content
Hi Sreeharsha
Try adding two variables for ex:lowest=0,heighest=10
and add a caliculated dimension by using if condition
Regards
Harsha
- Mark as New
- Bookmark
- Subscribe
- Mute
- Subscribe to RSS Feed
- Permalink
- Report Inappropriate Content
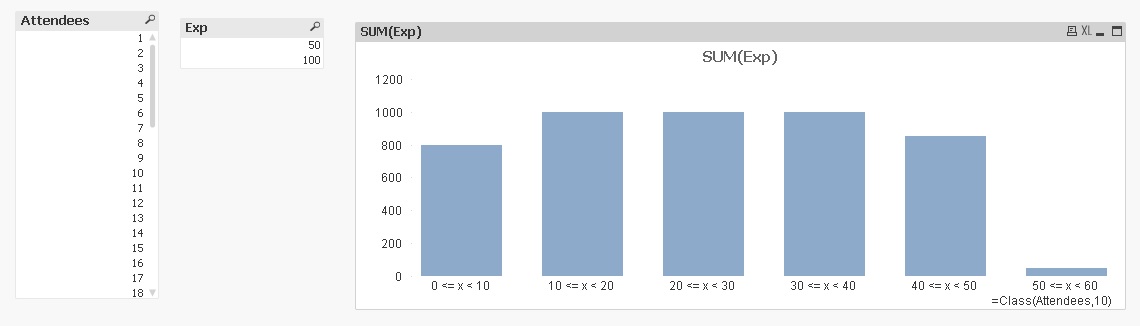
try this
class(attendees,10) in dimension
- Mark as New
- Bookmark
- Subscribe
- Mute
- Subscribe to RSS Feed
- Permalink
- Report Inappropriate Content
Hello Jagadeesh,
Please find the attached excel with sample data, and i also created a sample chart how i am expecting in Qlikview
Thanks
- Mark as New
- Bookmark
- Subscribe
- Mute
- Subscribe to RSS Feed
- Permalink
- Report Inappropriate Content
You can write like
Let vX = 10;
Dimension:- Class(attendees,vX)
Expression:- sum(expenses)
Regards
Anand
- Mark as New
- Bookmark
- Subscribe
- Mute
- Subscribe to RSS Feed
- Permalink
- Report Inappropriate Content
Hello All,
Thanks for all responses, I used class function but not working as expected
Can any body please look into the sample data, and help me,
Thanks
- Mark as New
- Bookmark
- Subscribe
- Mute
- Subscribe to RSS Feed
- Permalink
- Report Inappropriate Content
As suggested by our friends, you can use class function. I am unable to open your excel as i need it in XLS format.
- Mark as New
- Bookmark
- Subscribe
- Mute
- Subscribe to RSS Feed
- Permalink
- Report Inappropriate Content
hi find the attachment
- « Previous Replies
- Next Replies »