Unlock a world of possibilities! Login now and discover the exclusive benefits awaiting you.
- Qlik Community
- :
- All Forums
- :
- QlikView App Dev
- :
- Re: How to create dynamic comparison table with tr...
- Subscribe to RSS Feed
- Mark Topic as New
- Mark Topic as Read
- Float this Topic for Current User
- Bookmark
- Subscribe
- Mute
- Printer Friendly Page
- Mark as New
- Bookmark
- Subscribe
- Mute
- Subscribe to RSS Feed
- Permalink
- Report Inappropriate Content
How to create dynamic comparison table with trend , based on prior period rank ?
Hi All ,
How to create dynamic comparison table with trend , based on prior period rank ?
Data Input
| Year-Qtr | Stakeholder | Location | Strike_Intensity_Rank |
|---|---|---|---|
| 2016-Q1 | Chromite Inc. | Frankfurt | 6 |
| 2016-Q2 | Falcon Sphere | Lisbon | 4 |
| 2016-Q3 | Drome Lui and CO. | Seol | 8 |
| 2016-Q4 | A&A Confectionary | Sychelles | 8 |
| 2016-Q1 | Chromite Inc. | - | 5 |
| 2016-Q2 | Falcon Sphere | - | 6 |
| 2016-Q3 | Drome Lui and CO. | - | 8 |
| 2016-Q4 | A&A Confectionary | - | 3 |
| 2017-Q1 | Chromite Inc. | Frankfurt | 2 |
| 2017-Q2 | Falcon Sphere | Lisbon | 7 |
| 2017-Q3 | Drome Lui and CO. | Seol | 3 |
| 2017-Q4 | A&A Confectionary | Sychelles | 8 |
| 2017-Q1 | Chromite Inc. | - | 8 |
| 2017-Q2 | Warton Engineering | - | 8 |
| 2017-Q3 | Drome Lui and CO. | - | 4 |
| 2017-Q4 | A&A Confectionary | - | 9 |
| 2018-Q1 | Chromite Inc. | Frankfurt | 9 |
| 2018-Q2 | Falcon Sphere | Lisbon | 6 |
| 2018-Q3 | Drome Lui and CO. | Seol | 4 |
| 2018-Q4 | A&A Confectionary | Sychelles | 1 |
| 2018-Q1 | Chromite Inc. | - | 6 |
| 2018-Q2 | Falcon Sphere | - | 7 |
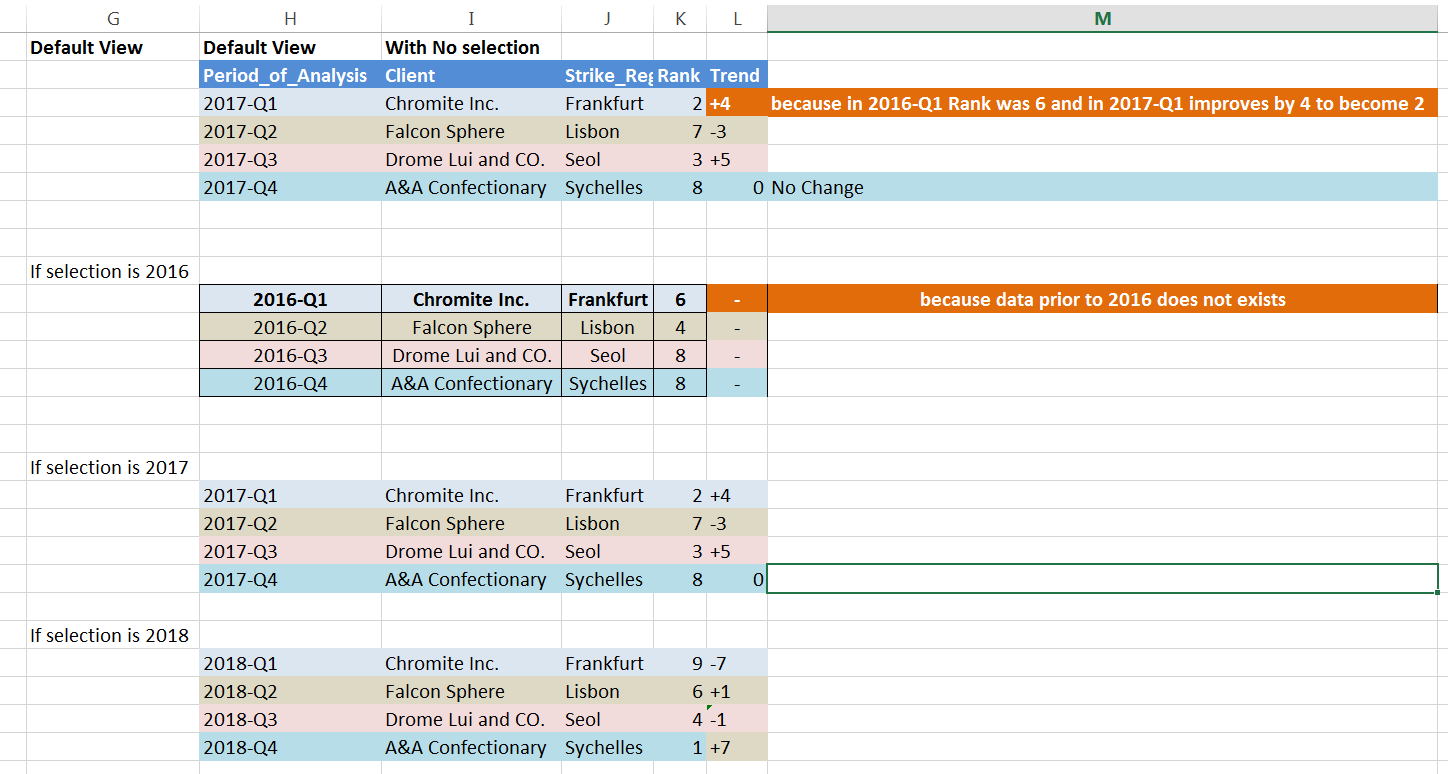
OUPUT : When Default Period Range = 1
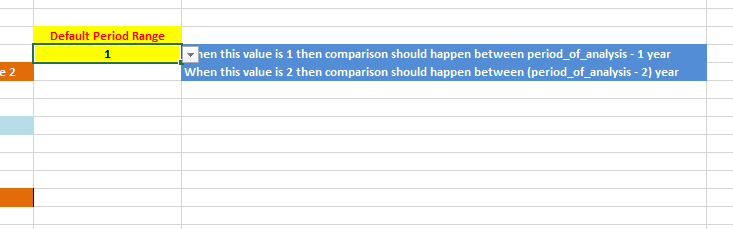
Default period Range

Thanks & Regards
Shekar
- Mark as New
- Bookmark
- Subscribe
- Mute
- Subscribe to RSS Feed
- Permalink
- Report Inappropriate Content
Then use this
Location = {"*"}
Don't take me in a wrong way, but are you not comfortable in using simple set analysis like this? I strongly suggest mastering set analysis as that is one of the easier things you can quickly learn.
- Mark as New
- Bookmark
- Subscribe
- Mute
- Subscribe to RSS Feed
- Permalink
- Report Inappropriate Content
default period range functionality
- Mark as New
- Bookmark
- Subscribe
- Mute
- Subscribe to RSS Feed
- Permalink
- Report Inappropriate Content
What exactly is that?
- Mark as New
- Bookmark
- Subscribe
- Mute
- Subscribe to RSS Feed
- Permalink
- Report Inappropriate Content
Not at all . Any advice from you is highly welcomed .
That was not a problem though . Extremely Sorry for trivial stuff .
- Mark as New
- Bookmark
- Subscribe
- Mute
- Subscribe to RSS Feed
- Permalink
- Report Inappropriate Content
Ok .
These are some set of values in Input box .
When value is 1 , then we get result exactly like what you have shared . Which means take period from dimension values and compare its rank with a year back data (rank) .
So when this value is 2 then , it should toggle 2 year back .
for example : for 2018-Q1 , it should compare rank of 2016-Q1 .
So when this value is 3 then , it should toggle 3 year back .
for example : for 2018-Q1 , it should compare rank of 2015-Q1 .
- Mark as New
- Bookmark
- Subscribe
- Mute
- Subscribe to RSS Feed
- Permalink
- Report Inappropriate Content
check now...
- Mark as New
- Bookmark
- Subscribe
- Mute
- Subscribe to RSS Feed
- Permalink
- Report Inappropriate Content
Namo .. Please Take a bow from myself
- Mark as New
- Bookmark
- Subscribe
- Mute
- Subscribe to RSS Feed
- Permalink
- Report Inappropriate Content
Hi Sunny Bhai , stalwar1
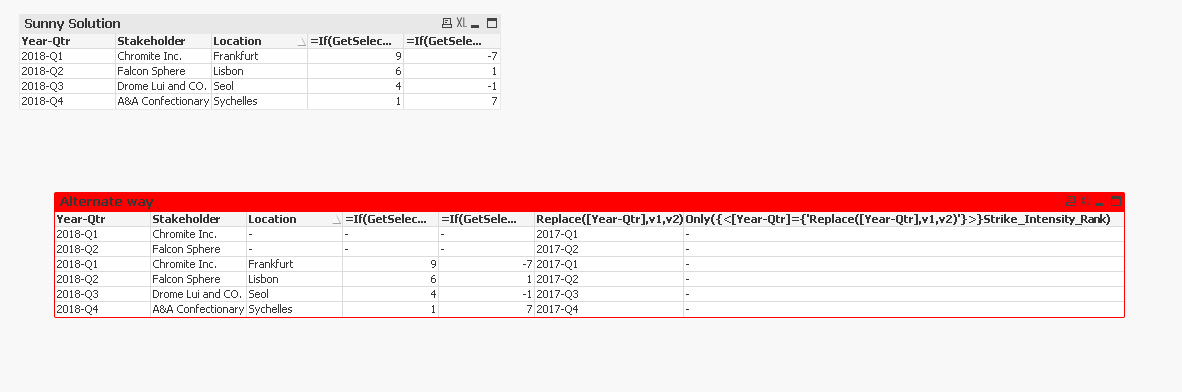
I tried alternate way using replace function and variable , but in vain .
Can you please help me know that what is wrong with it ?
Thanks & Regards
Shekar
- Mark as New
- Bookmark
- Subscribe
- Mute
- Subscribe to RSS Feed
- Permalink
- Report Inappropriate Content
You want this to work in set analysis? But set analysis only get evaluated once per chart.... you cannot have dimension wise expansion of set analysis... unfortunately, this won't work...
- Mark as New
- Bookmark
- Subscribe
- Mute
- Subscribe to RSS Feed
- Permalink
- Report Inappropriate Content
Ok . Any other alternate way to your existing solution . Probably at script level .