Unlock a world of possibilities! Login now and discover the exclusive benefits awaiting you.
- Qlik Community
- :
- All Forums
- :
- QlikView App Dev
- :
- How to create reference
- Subscribe to RSS Feed
- Mark Topic as New
- Mark Topic as Read
- Float this Topic for Current User
- Bookmark
- Subscribe
- Mute
- Printer Friendly Page
- Mark as New
- Bookmark
- Subscribe
- Mute
- Subscribe to RSS Feed
- Permalink
- Report Inappropriate Content
How to create reference
Hi all,
I am very new to Qlikview.
I need expert help for report I am developing.
I have a report requirement where i need a reference to select and based on reference my bar chart should show the result.
I need selection in reference as : Budget/ Target
If i select Budget reference,my bar chart should display as Acutal,Budget and Forecast against Month (x-axis) and Amount (y-axis)
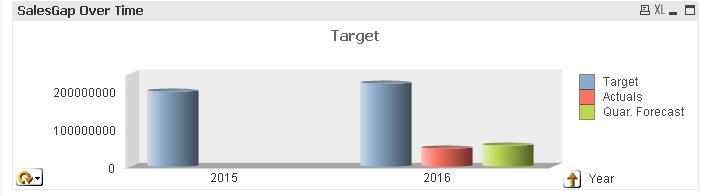
If i select Target reference, my bar chart should display as Actual Target and Forecast against Month (x-axis) and Amount (y-axis)
Can anyone help me to achieve this.
Regards
Prasoon
Accepted Solutions
- Mark as New
- Bookmark
- Subscribe
- Mute
- Subscribe to RSS Feed
- Permalink
- Report Inappropriate Content
You can for example use an expression group in your chart to toggle between Budget and Target (create the two expressions, then group the expressions on expressiont tab).
Or use conditional expressions, like shown in the What's New in QV11 sample QVW for the ad-hoc reporting sample table.
- Mark as New
- Bookmark
- Subscribe
- Mute
- Subscribe to RSS Feed
- Permalink
- Report Inappropriate Content
Hi,
Refer this app,
- Mark as New
- Bookmark
- Subscribe
- Mute
- Subscribe to RSS Feed
- Permalink
- Report Inappropriate Content
Hi,
Thanks for your reply, it really worked. I want few more Customization:
1. I want to make a button as name "Reference" instead of
 Symbol. When I click Reference, it should give me option like Budget/Target.
2. I want to filter this report only for yearMonth >='201601' onwards.
Please help me to achieve it.
- Mark as New
- Bookmark
- Subscribe
- Mute
- Subscribe to RSS Feed
- Permalink
- Report Inappropriate Content
1. If you click on the small arrow, a drop down should allow you directly select from the expressions available in the expression group
Alternatively, use conditional expressions and create e.g. a list box on a data island field or buttons to toggle between your expression (refer to the sample QVW referenced above or search the forum for 'ad-hoc report' to get some demos).
2. You can filter your report either by using a calculated dimension
=If(Year >= 2016, Year)
or using set analysis in all your expression aggreggations, for example something like
=Sum({<Year = {2016}>} Target)