Unlock a world of possibilities! Login now and discover the exclusive benefits awaiting you.
- Qlik Community
- :
- All Forums
- :
- QlikView App Dev
- :
- How to display Bars?
- Subscribe to RSS Feed
- Mark Topic as New
- Mark Topic as Read
- Float this Topic for Current User
- Bookmark
- Subscribe
- Mute
- Printer Friendly Page
- Mark as New
- Bookmark
- Subscribe
- Mute
- Subscribe to RSS Feed
- Permalink
- Report Inappropriate Content
How to display Bars?
Hi ,
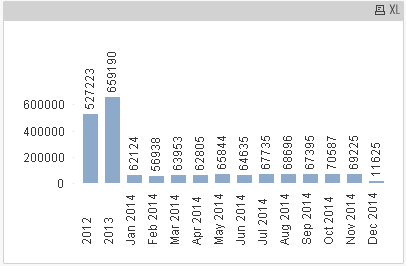
I have 4 years of sales and i created a bar chart for Present year sales,previous years sales month wise but i want to represent
present year sales according to month wise remaining all years sales i want to represent as a single bar.how to achieve it please guide me .
Thanks.
- « Previous Replies
-
- 1
- 2
- Next Replies »
- Mark as New
- Bookmark
- Subscribe
- Mute
- Subscribe to RSS Feed
- Permalink
- Report Inappropriate Content
Thanks Nagaiank,
in the above chart 2011,2012,2013 years data also it has to show in a single bar that is my scenario. i will work around it. thanks once again.
- Mark as New
- Bookmark
- Subscribe
- Mute
- Subscribe to RSS Feed
- Permalink
- Report Inappropriate Content
Hi John,
PFA. I have modified Nagaian qvw.
Ignore the QVW Name. I have created single bar only for all other years.
BR,
Chinna
- Mark as New
- Bookmark
- Subscribe
- Mute
- Subscribe to RSS Feed
- Permalink
- Report Inappropriate Content
Hi John,
You can try also for dynamically load the current year data as month wise and rest of the data as Year wise
1. First way
Dim:- =If(Year =Year(Today()),MonthName(Datefield),Year) //Calculated Dimension
Expre:- sum(sales)
2. Second Way
Dim:- =If(Year =Year(Today()),MonthName(Datefield),'All Year') //Calculated Dimension
Expre:- sum(sales)
Regards
Anand
- Mark as New
- Bookmark
- Subscribe
- Mute
- Subscribe to RSS Feed
- Permalink
- Report Inappropriate Content
hi Chinna katiki
Thanks for your help.but i am using PE so i can't able to see your application.
- « Previous Replies
-
- 1
- 2
- Next Replies »