Unlock a world of possibilities! Login now and discover the exclusive benefits awaiting you.
Announcements
Save $650 on Qlik Connect, Dec 1 - 7, our lowest price of the year. Register with code CYBERWEEK: Register
- Qlik Community
- :
- All Forums
- :
- QlikView App Dev
- :
- How to display cumulative data in graph for latest...
Options
- Subscribe to RSS Feed
- Mark Topic as New
- Mark Topic as Read
- Float this Topic for Current User
- Bookmark
- Subscribe
- Mute
- Printer Friendly Page
Turn on suggestions
Auto-suggest helps you quickly narrow down your search results by suggesting possible matches as you type.
Showing results for
Not applicable
2013-09-06
05:00 AM
- Mark as New
- Bookmark
- Subscribe
- Mute
- Subscribe to RSS Feed
- Permalink
- Report Inappropriate Content
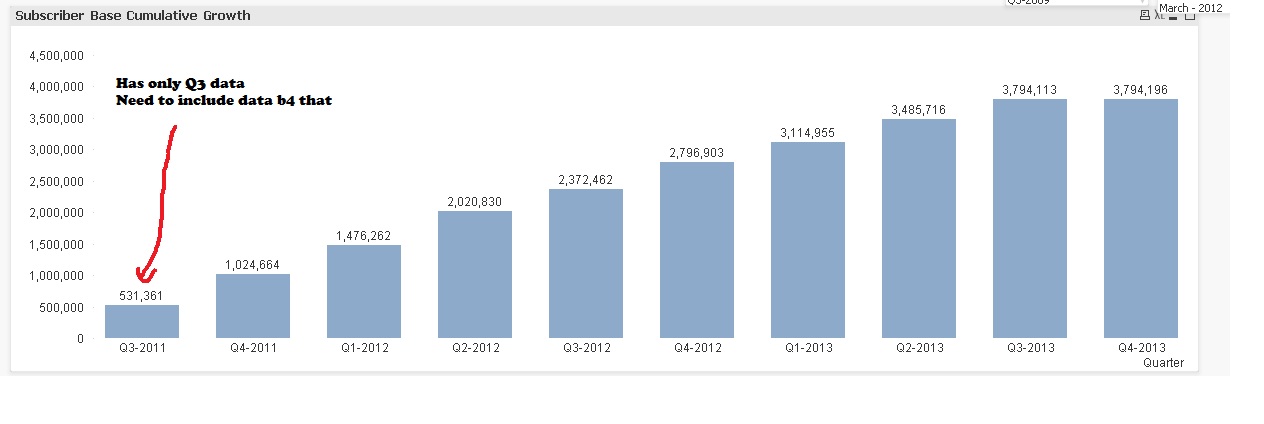
How to display cumulative data in graph for latest 10 quarter and the historic data should be added up
Hi,
I have a data which consists of last10 years of data. But i would want to display only present 10 quarters, and add up the historic data in it. Also could you please help me sorting the data in descending order where i dont have any fields of "date time" data type
- Tags:
- new_to_qlikview
804 Views
1 Reply
MVP
2013-09-06
05:04 AM
- Mark as New
- Bookmark
- Subscribe
- Mute
- Subscribe to RSS Feed
- Permalink
- Report Inappropriate Content
PFA.
If you are struggling with sorting, please share your sample app.
420 Views