Unlock a world of possibilities! Login now and discover the exclusive benefits awaiting you.
- Qlik Community
- :
- All Forums
- :
- QlikView App Dev
- :
- How to display data points on gantt chart (made us...
- Subscribe to RSS Feed
- Mark Topic as New
- Mark Topic as Read
- Float this Topic for Current User
- Bookmark
- Subscribe
- Mute
- Printer Friendly Page
- Mark as New
- Bookmark
- Subscribe
- Mute
- Subscribe to RSS Feed
- Permalink
- Report Inappropriate Content
How to display data points on gantt chart (made using bar chart)
Hi,
I'm trying to create a gantt chart by following this link : Recipe for a Gantt chart
I'm able to draw the gantt chart, but i'm not able to show values on the graph.
I have three tables : Release Date, Mainstream Support End Date, Extended Support End Date, each date in these tables is associated with a technology(like Java, .Net, Oracle etc.) stored in Technology table (which is my dimension).
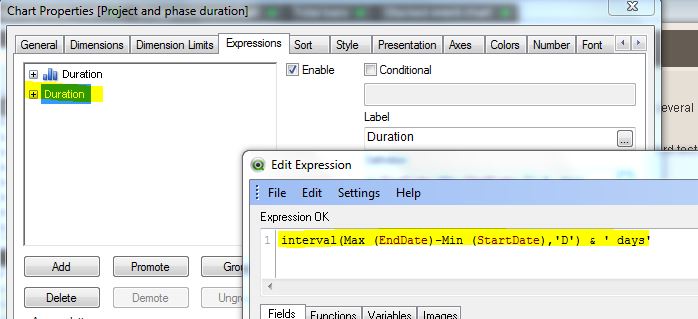
I have two expressions to calculate the difference between the dates(as explained in the tutorial) and two expressions to display as data point on graph
First expression: [Support End Date]-[Release Date]
First Label expression: [Release Date]&'-'&[Support End Date]
Second Expression: [Extended Support End Date]-[Release Date]
Second Label expression: [Release Date]&'-'&[Extended Support End Date]
Please guide me if i'm missing something or if it can't be achieved using bar graph.
- Mark as New
- Bookmark
- Subscribe
- Mute
- Subscribe to RSS Feed
- Permalink
- Report Inappropriate Content
Hi,
You Need to add one more expression to display the values.
Check the below link from hic
Files for creation of a Gantt chart
- Mark as New
- Bookmark
- Subscribe
- Mute
- Subscribe to RSS Feed
- Permalink
- Report Inappropriate Content
hi,
thanks for replying.
So this example uses single expression to calculate values, and another expression to show some value on the graph, which works for me as well. But i want to use two expressions, so that for each dimension value i have two bars on the graph. So i need another two expressions for displaying value on both bars, which i did but the problem is i'm only getting the value displayed on only one bar (and it is always showing the value on the bar calculated using expression at the bottom in Expression tab)