Unlock a world of possibilities! Login now and discover the exclusive benefits awaiting you.
- Qlik Community
- :
- All Forums
- :
- QlikView App Dev
- :
- How to display each country population with expres...
- Subscribe to RSS Feed
- Mark Topic as New
- Mark Topic as Read
- Float this Topic for Current User
- Bookmark
- Subscribe
- Mute
- Printer Friendly Page
- Mark as New
- Bookmark
- Subscribe
- Mute
- Subscribe to RSS Feed
- Permalink
- Report Inappropriate Content
How to display each country population with expression in Qlikview?
hi ,
I created Drill Down in Qlik view I want to display Each country population in my chart i do not know how to display country wise population with expression.please tell me out how to disply country wise in chart . I Attached snipping files below this box.
Thanks
Regards:
Madhu
- Mark as New
- Bookmark
- Subscribe
- Mute
- Subscribe to RSS Feed
- Permalink
- Report Inappropriate Content
You may have to use Count function instead of Sum.
Count(ID)
- Mark as New
- Bookmark
- Subscribe
- Mute
- Subscribe to RSS Feed
- Permalink
- Report Inappropriate Content
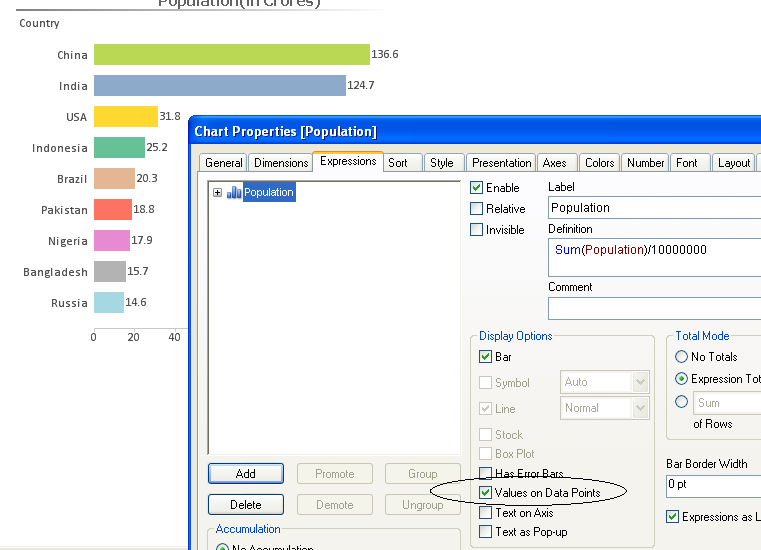
See the Snapshot and check the Values on Data Points in Expression:

Also, see the Attachment.
Regards
Aviral Nag
- Mark as New
- Bookmark
- Subscribe
- Mute
- Subscribe to RSS Feed
- Permalink
- Report Inappropriate Content
I followed your expression but the date is not displayed in my chart Nag aviral.ple tell me how to display data in my chart.
- Mark as New
- Bookmark
- Subscribe
- Mute
- Subscribe to RSS Feed
- Permalink
- Report Inappropriate Content
Please Attach your file.
- Mark as New
- Bookmark
- Subscribe
- Mute
- Subscribe to RSS Feed
- Permalink
- Report Inappropriate Content
Nag aviral I attached my file above my box that DD7 and DD8 snipping files.ple see and replay
- Mark as New
- Bookmark
- Subscribe
- Mute
- Subscribe to RSS Feed
- Permalink
- Report Inappropriate Content
From the Attached images, i am not able to help you out. Can you Attach your Application so that i can understand your data and answer you in a better way.
- Mark as New
- Bookmark
- Subscribe
- Mute
- Subscribe to RSS Feed
- Permalink
- Report Inappropriate Content
Please, let us know how is your model. Do you have the CountryID and Population in the same table? If you don´t, you need to join tables using key fields. Assuming you have CountryID in one table and Population in other table, you would need to have CountryID and Population in the same table so you can join the data, if you don't, your data will have no relation and you will not be able to do calculations over your dimensions.
Attach your file or a print screen of your model at least so we can help you
Regards