Unlock a world of possibilities! Login now and discover the exclusive benefits awaiting you.
- Qlik Community
- :
- All Forums
- :
- QlikView App Dev
- :
- How to display expressions on X-axis in a bar char...
Options
- Subscribe to RSS Feed
- Mark Topic as New
- Mark Topic as Read
- Float this Topic for Current User
- Bookmark
- Subscribe
- Mute
- Printer Friendly Page
Turn on suggestions
Auto-suggest helps you quickly narrow down your search results by suggesting possible matches as you type.
Showing results for
Partner - Contributor
2016-09-26
10:00 AM
- Mark as New
- Bookmark
- Subscribe
- Mute
- Subscribe to RSS Feed
- Permalink
- Report Inappropriate Content
How to display expressions on X-axis in a bar chart ?
Hi all,
I would like to display the 4 expressions on the X-axis and the 1 dimension ( 6 values ) in the legend. I just can't get it to work... I can only get expressions on the X-axis without a dimension.
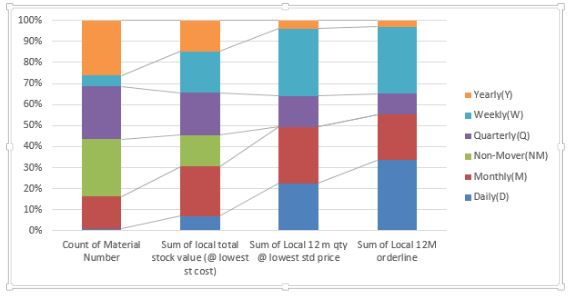
Can someone assist me on this or provide a better alternative ?
Thanks in advance.
Jan
418 Views
0 Replies