Unlock a world of possibilities! Login now and discover the exclusive benefits awaiting you.
- Qlik Community
- :
- All Forums
- :
- QlikView App Dev
- :
- How to display only certain values in a table?
- Subscribe to RSS Feed
- Mark Topic as New
- Mark Topic as Read
- Float this Topic for Current User
- Bookmark
- Subscribe
- Mute
- Printer Friendly Page
- Mark as New
- Bookmark
- Subscribe
- Mute
- Subscribe to RSS Feed
- Permalink
- Report Inappropriate Content
How to display only certain values in a table?
Hello,
I am so new to this, and need your help.
This is my table
| Cars | Country | Models |
|---|---|---|
| BMW | GER | 12 |
| TOYOTA | JPN | 20 |
| HONDA | JPN | 18 |
| NISSAN | JPN | 15 |
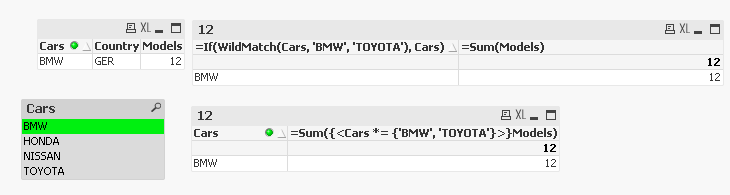
I need to display information for just BMW and Toyota. How do I do that ?
| Cars | Models | |
|---|---|---|
| BMW | 12 | |
| TOYOTA | 20 |
I tried =if(match(Cars,'BMW', 'TOYOTA', ), Cars,'OTHER')
and added Expression sum(Models)
The problem with that one is that i don't want to display any other values but with my calculated dimension I get OTHER row. I don't want to show anything else.
Thanks a lot
- « Previous Replies
- Next Replies »
- Mark as New
- Bookmark
- Subscribe
- Mute
- Subscribe to RSS Feed
- Permalink
- Report Inappropriate Content
I don't have to prove you anything, do whatever you like.
True, but if, as you say, you want to warn the unaware then just 'because I say so' is not a very strong argument. An example we can learn from would be far more useful.
talk is cheap, supply exceeds demand
- Mark as New
- Bookmark
- Subscribe
- Mute
- Subscribe to RSS Feed
- Permalink
- Report Inappropriate Content
Yes,agreed. Should use set analysis
- Mark as New
- Bookmark
- Subscribe
- Mute
- Subscribe to RSS Feed
- Permalink
- Report Inappropriate Content
Gysbert, read the full thread, that was a reply to
If you can prove me otherwise, I would still think that set analysis can be a useful approach here
I made my point from the first post:
Set Analysis is not the answer to everything.
The main problem with it is that it breaks the basic rule of QlikView: click and view. You no longer see what your selection tells you to, but some rule hidden inside an expression. It's tricky and not transparent to the user.
Yes, it is powerfull. Thats one more reason to use it carefully.
Helping somebody is not just about giving him the technical solution, but helping him to ask the right questions.
- Mark as New
- Bookmark
- Subscribe
- Mute
- Subscribe to RSS Feed
- Permalink
- Report Inappropriate Content
Lucian have you got a chance to look at the sample? Are you not able to click around and see the selections make an impact the same way as calculated dimension?

I see the same results using set analysis? What is a potential issue here? I am just looking for you to point me in the right direction if you think I am wrong my friend.
- Mark as New
- Bookmark
- Subscribe
- Mute
- Subscribe to RSS Feed
- Permalink
- Report Inappropriate Content
Well, I am only replying to this post because I was asked to 
I do agree with Lucian: Set Analyis is not the answer to everything.
He made a valid point that using set analysis in charts may confuse users due to the chart-specific filtered data, but he does not really explain very well in what aspect the calculated dimension does it any better here.
The confusion should be avoided by given the user a clear notice what is shown in the chart, though.
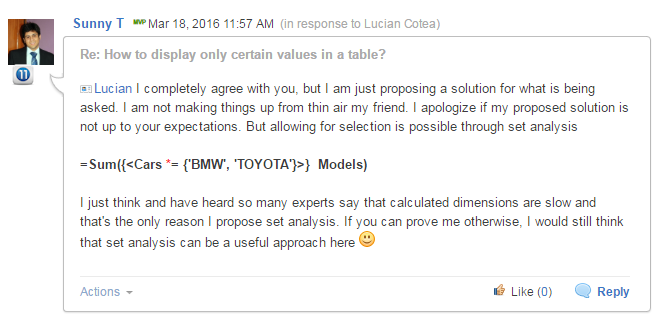
I do agree with Sunny: it's good to show the original poster an alternative solution to the calculated dimension.
His solution seems to be equally valid given the information provided.
If this solution is better? Who knows, without knowing the full context and requirements.
I haven't read any comment as being particularly aggressive or offensive, might be that's because I am not a native speaker so I missed the subtilities 
In total, I do agree with all of you, even the un-mentioned. After all, it's friday evening...
Regards,
Stefan
- Mark as New
- Bookmark
- Subscribe
- Mute
- Subscribe to RSS Feed
- Permalink
- Report Inappropriate Content
Appreciate your feedback swuehl gwassenaar.
- Mark as New
- Bookmark
- Subscribe
- Mute
- Subscribe to RSS Feed
- Permalink
- Report Inappropriate Content
None of these examples looks like your initial solution.
I am glad that I made you think about it and you've got the point.
- Mark as New
- Bookmark
- Subscribe
- Mute
- Subscribe to RSS Feed
- Permalink
- Report Inappropriate Content
I am glad we agree now that set analysis can work .
Although not to offend you, but just so you know I did mention this expression above
UPDATE: Yes, this was after you mentioned that this won't work. But I don't even know what the requirement was with regards to selections
- « Previous Replies
- Next Replies »