Unlock a world of possibilities! Login now and discover the exclusive benefits awaiting you.
Announcements
Independent validation for trusted, AI-ready data integration. See why IDC named Qlik a Leader: Read the Excerpt!
- Qlik Community
- :
- All Forums
- :
- QlikView App Dev
- :
- How to do Sum of the values per project?
Options
- Subscribe to RSS Feed
- Mark Topic as New
- Mark Topic as Read
- Float this Topic for Current User
- Bookmark
- Subscribe
- Mute
- Printer Friendly Page
Turn on suggestions
Auto-suggest helps you quickly narrow down your search results by suggesting possible matches as you type.
Showing results for
Creator III
2018-09-04
01:54 PM
- Mark as New
- Bookmark
- Subscribe
- Mute
- Subscribe to RSS Feed
- Permalink
- Report Inappropriate Content
How to do Sum of the values per project?
Hello,
I have Project_number, Report Parameter and Value columns in my table. For every project, there are multiple Report Parameters like Sales, GM_Per, Risk and the values associated with them. Something as shown in below picture;
| Project_No | Report_Param | Value |
| 113913 | Sales | 14.907 |
| 113913 | GM_Per | 24.80% |
| 113913 | Risk | 21.25 |
| 123456 | Sales | 31.5 |
| 123456 | GM_Per | 11.20% |
| 123456 | Risk | 9.87 |
Here is the table chart I am getting for project no.113913 as shown below
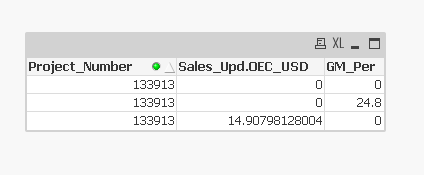
I am trying to get a visual like as shown below, Please help me to modify the script to get sum all the values and build a table like this.
So that I can compare the Sales vs Gross_Profit _Percentages.
| Project_no | Sum(Sales) | Sum(GM_Per) |
|---|---|---|
| 133913 | 14.907 | 24.8 |
Any help is greatly appreciated
thanks
Bhavesh
1,528 Views
- « Previous Replies
-
- 1
- 2
- Next Replies »
10 Replies
Champion III
2018-09-04
02:35 PM
- Mark as New
- Bookmark
- Subscribe
- Mute
- Subscribe to RSS Feed
- Permalink
- Report Inappropriate Content
Can you share this qvw file to look into?
157 Views
- « Previous Replies
-
- 1
- 2
- Next Replies »