Unlock a world of possibilities! Login now and discover the exclusive benefits awaiting you.
- Qlik Community
- :
- All Forums
- :
- QlikView App Dev
- :
- How to do aggregation in Chart - table
Options
- Subscribe to RSS Feed
- Mark Topic as New
- Mark Topic as Read
- Float this Topic for Current User
- Bookmark
- Subscribe
- Mute
- Printer Friendly Page
Turn on suggestions
Auto-suggest helps you quickly narrow down your search results by suggesting possible matches as you type.
Showing results for
Contributor III
2016-09-07
07:23 AM
- Mark as New
- Bookmark
- Subscribe
- Mute
- Subscribe to RSS Feed
- Permalink
- Report Inappropriate Content
How to do aggregation in Chart - table
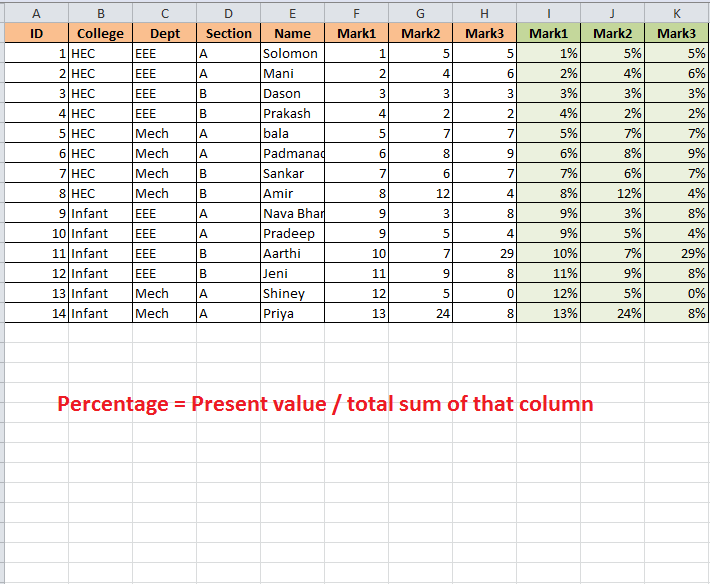
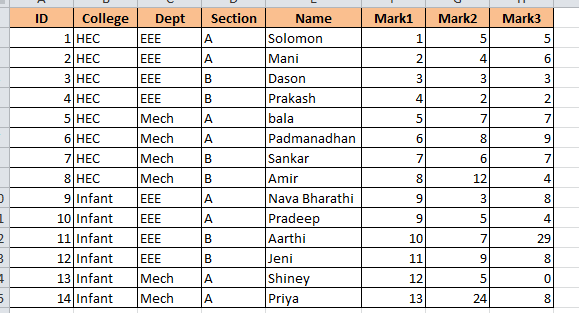
- I want to represent data in the (Data_1 --> Sheet 1 ) as (Data_1 --> Sheet2).
749 Views
4 Replies
2016-09-07
11:31 AM
- Mark as New
- Bookmark
- Subscribe
- Mute
- Subscribe to RSS Feed
- Permalink
- Report Inappropriate Content
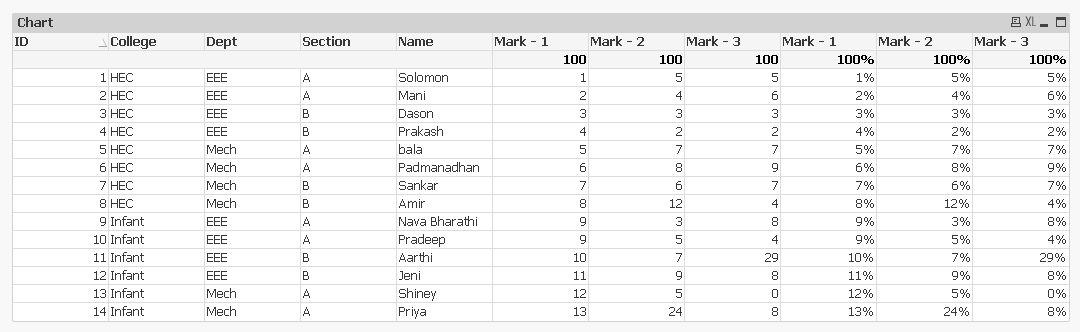
Is this you are expecting?
I've update new one, My muistake
Best Anil, When applicable please mark the correct/appropriate replies as "solution" (you can mark up to 3 "solutions". Please LIKE threads if the provided solution is helpful
MVP
2016-09-07
03:26 PM
- Mark as New
- Bookmark
- Subscribe
- Mute
- Subscribe to RSS Feed
- Permalink
- Report Inappropriate Content
Another option would be to create three new expressions like this:
=Sum(Mark1)/Sum(TOTAL Mark1)
=Sum(Mark2)/Sum(TOTAL Mark2)
=Sum(Mark3)/Sum(TOTAL Mark3)
Contributor III
2016-09-07
10:57 PM
Author
- Mark as New
- Bookmark
- Subscribe
- Mute
- Subscribe to RSS Feed
- Permalink
- Report Inappropriate Content
Dear Anil,
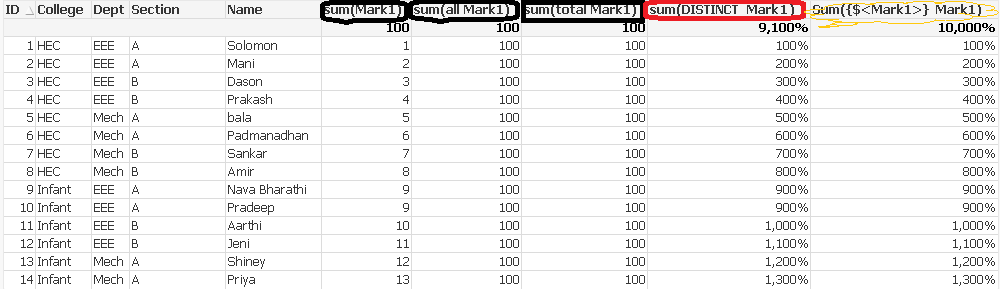
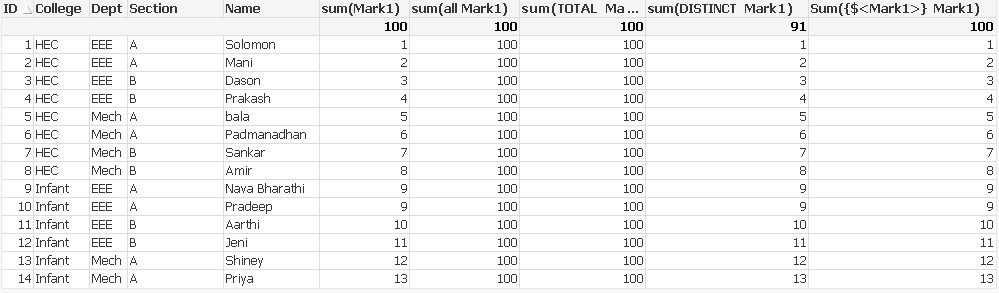
Can you please tell me what is the difference between
1. Sum(Mark1)
2. Sum( All Mark1)
3. Sum(Total Mark1)
4. Sum(Distinct Mark1)
5. Sum(${Mark1} Mark1)
685 Views
2016-09-08
02:22 AM
- Mark as New
- Bookmark
- Subscribe
- Mute
- Subscribe to RSS Feed
- Permalink
- Report Inappropriate Content
I recommend you start your self by hand then you will get more clarification. please find attachment then observe, Which is make sense... 
With %
Without %
Best Anil, When applicable please mark the correct/appropriate replies as "solution" (you can mark up to 3 "solutions". Please LIKE threads if the provided solution is helpful
685 Views