Unlock a world of possibilities! Login now and discover the exclusive benefits awaiting you.
- Qlik Community
- :
- All Forums
- :
- QlikView App Dev
- :
- How to find the MaxDate for a Calculated Expressio...
- Subscribe to RSS Feed
- Mark Topic as New
- Mark Topic as Read
- Float this Topic for Current User
- Bookmark
- Subscribe
- Mute
- Printer Friendly Page
- Mark as New
- Bookmark
- Subscribe
- Mute
- Subscribe to RSS Feed
- Permalink
- Report Inappropriate Content
How to find the MaxDate for a Calculated Expression
Hi QlikViewers,
Requesting your help here. I have a Straight Table in QlikView Application. In addition to this chart, I have multiple filters. Chart will be responding to the selections made in these filters. Each time the selection is made, the max month may change depending upon the filters.
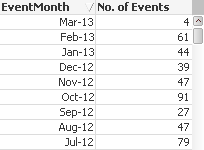
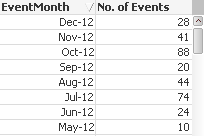
Now, will it be possible for us to get the Max Month from the above chart (in the first case, it will be Mar-13 and 91 - and in second case it will be Dec12)? Essentially, I would want to display the max month, min month and total number of months shown in the chart in a separate text objects.
Appreciate your support.
Thanks & Regards,
Raajesh N
- « Previous Replies
-
- 1
- 2
- Next Replies »
- Mark as New
- Bookmark
- Subscribe
- Mute
- Subscribe to RSS Feed
- Permalink
- Report Inappropriate Content
Hi All,
Thansk for all the responses. However, sorry - I am yet to get an answer. I guess I need to give more information on the issue and hence, I have created a mock for the same. I have given a snapshot of the same along with data being used + the expected result in two text boxes - given just below the charts.
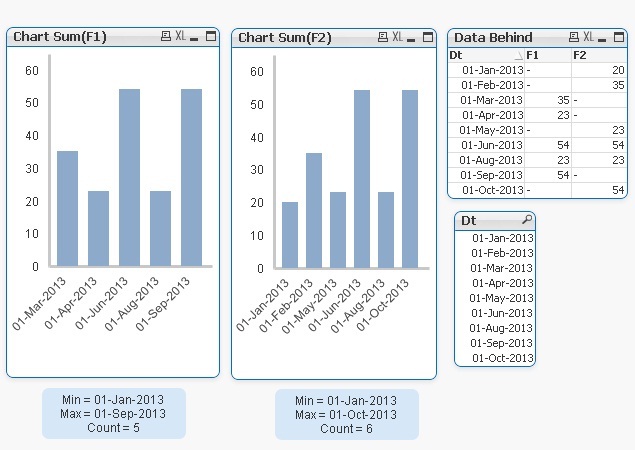
Also, the text boxes (currently hardcoded should change as per the filters - I have added only one filter now, but there will be multiple filters in the actual application).
Appreciate your support.
Thanks & Regards,
Raajesh N
- Mark as New
- Bookmark
- Subscribe
- Mute
- Subscribe to RSS Feed
- Permalink
- Report Inappropriate Content
Hi,
Can I suggest you try
Max(TOTAL datefield) as Max Month
Min(TOTAL datefied) as Min Month
Regardds,
Gabriel.
- Mark as New
- Bookmark
- Subscribe
- Mute
- Subscribe to RSS Feed
- Permalink
- Report Inappropriate Content
Thanks for the response Gabriel.
This will not work, as the Max(Total Dt) will give me the max value from the entire data - I need it specific to chart.
Thanks & Regards,
Raajesh N
- « Previous Replies
-
- 1
- 2
- Next Replies »