Unlock a world of possibilities! Login now and discover the exclusive benefits awaiting you.
- Qlik Community
- :
- All Forums
- :
- QlikView App Dev
- :
- How to get an expression as an Image in a Full Acc...
- Subscribe to RSS Feed
- Mark Topic as New
- Mark Topic as Read
- Float this Topic for Current User
- Bookmark
- Subscribe
- Mute
- Printer Friendly Page
- Mark as New
- Bookmark
- Subscribe
- Mute
- Subscribe to RSS Feed
- Permalink
- Report Inappropriate Content
How to get an expression as an Image in a Full Accumulation Calculation
Hi guys! Happy new year!!
I've a dummy challenging thing about how to calculate full accumulation an show it as an image.
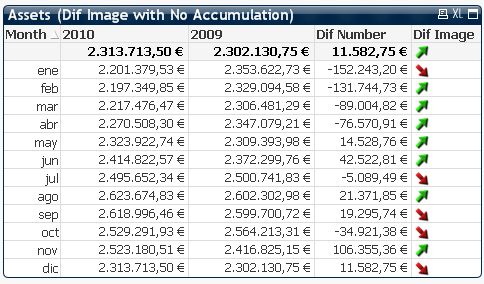
I've a chart with assets of 2010 year and 2009. And I'm doing a typical comparison between years.
The dif Number is a "full accumulation" calculation : column(1) - column(2).
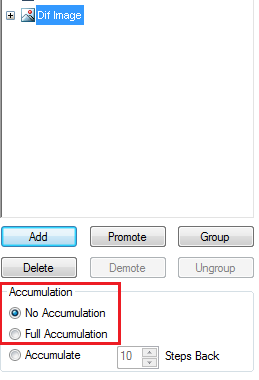
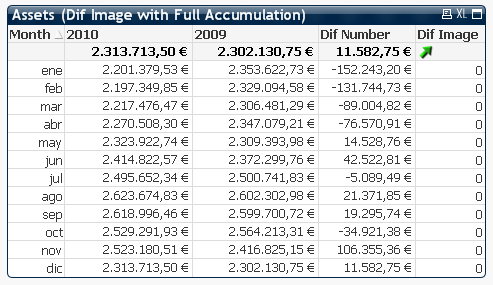
And I'm trying to do the same as an Image. If select the "No accumulation" check, there's no problem, but otherwise, if I check the "Full Accumulation", there's a 0 as a result.
What I'm doing wrong?
THis is what I'm referring with "No Accumulation " and "Full Accumulation" :
And this is my result with the calculation as an Image (first table is with "No Accumulation" and second table is with "Full Accumulation") :
Many thanks in advance!!!
Regards