Unlock a world of possibilities! Login now and discover the exclusive benefits awaiting you.
- Qlik Community
- :
- All Forums
- :
- QlikView App Dev
- :
- How to get subtraction and growth from one year ag...
- Subscribe to RSS Feed
- Mark Topic as New
- Mark Topic as Read
- Float this Topic for Current User
- Bookmark
- Subscribe
- Mute
- Printer Friendly Page
- Mark as New
- Bookmark
- Subscribe
- Mute
- Subscribe to RSS Feed
- Permalink
- Report Inappropriate Content
How to get subtraction and growth from one year against another that are in the same dimension
Hello everybody
It's a case that I could not resolve
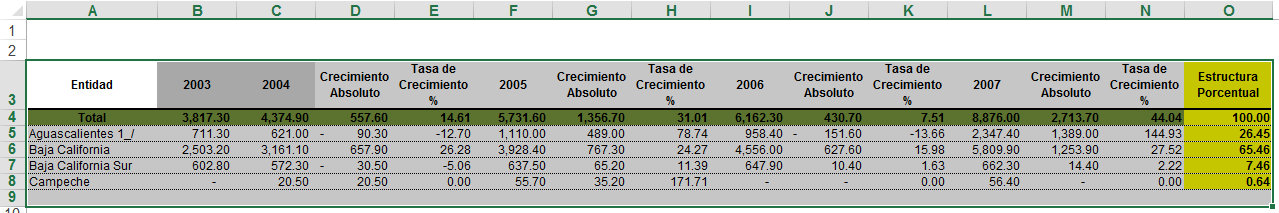
I need to get a table and graphics like the example in the excel, but i dont't know if this is possible directly in QV or need to apply a trick
The box below is one of the dashboard i need
The graphics as this:
| Header 1 | Header 2 |
|---|---|
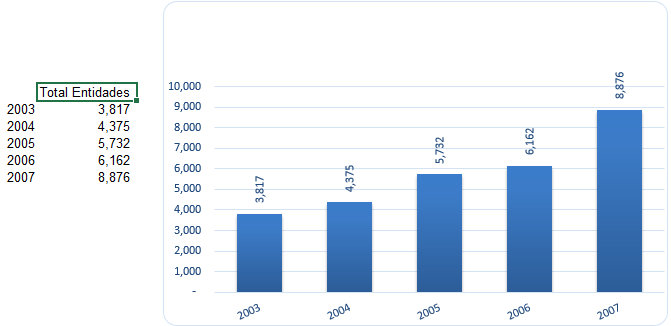 | 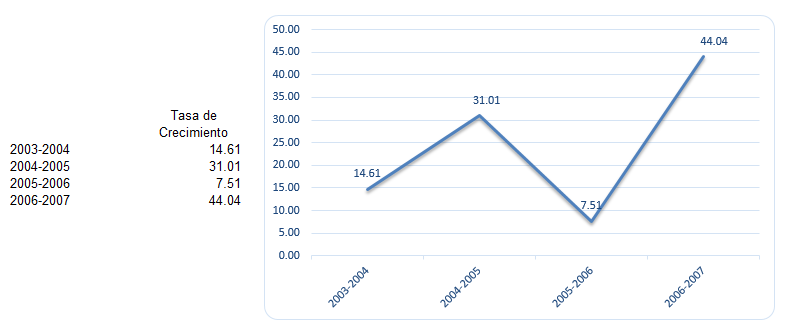 |
These examples in the attached Excel
Now, in QV I have a pivot table, pivotting the year (also attached my example), i did an example using Above but if i pivot, the data resulting is not what i want
Thanks in advance for your help
Victor Montand
- Tags:
- new_to_qlikview
Accepted Solutions
- Mark as New
- Bookmark
- Subscribe
- Mute
- Subscribe to RSS Feed
- Permalink
- Report Inappropriate Content
use before instead of above
- Mark as New
- Bookmark
- Subscribe
- Mute
- Subscribe to RSS Feed
- Permalink
- Report Inappropriate Content
use before instead of above
- Mark as New
- Bookmark
- Subscribe
- Mute
- Subscribe to RSS Feed
- Permalink
- Report Inappropriate Content
It's amazing how easy its to do anything when you have something called knowledge
Thank you very much Ramon !