Unlock a world of possibilities! Login now and discover the exclusive benefits awaiting you.
- Qlik Community
- :
- All Forums
- :
- QlikView App Dev
- :
- How to get the Set the Values Default in Line Char...
- Subscribe to RSS Feed
- Mark Topic as New
- Mark Topic as Read
- Float this Topic for Current User
- Bookmark
- Subscribe
- Mute
- Printer Friendly Page
- Mark as New
- Bookmark
- Subscribe
- Mute
- Subscribe to RSS Feed
- Permalink
- Report Inappropriate Content
How to get the Set the Values Default in Line Chart with Original data Point?
Hi All,
I have a Chart like below.
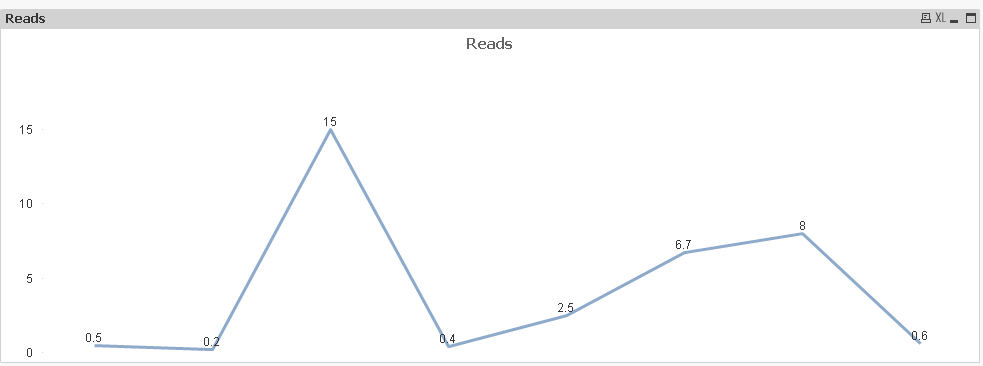
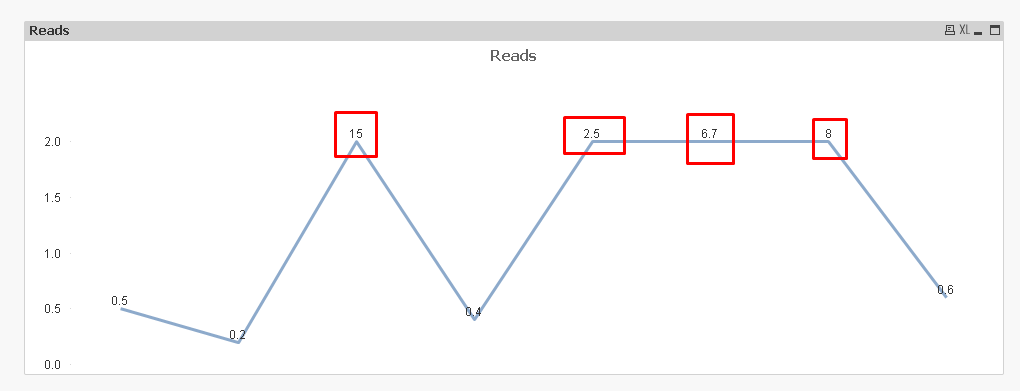
From the Above Chart, i need to Bring the value which is more than 2 to 2. But the actual value should be shown as a data point.Like below Screen Shot
I got the above chart But when I try to convert this to Percentage(%). I am getting the data point as 200 % default. It is not showing the actual value
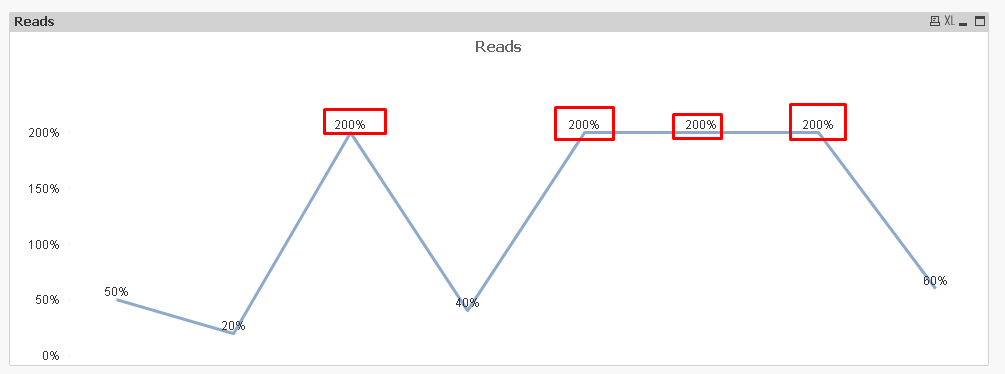
I Need to bring the Value Which is greater than 200% to 200%. by Showing its original value as a data Point
Please find the below attached qvw and Excel data for your reference
I need it in Expression, not in Script and also i need the out in % like above Screen Shot with Original data Points
Kindly Help me Out of this
Thanks,
Muthu
- « Previous Replies
-
- 1
- 2
- Next Replies »
- Mark as New
- Bookmark
- Subscribe
- Mute
- Subscribe to RSS Feed
- Permalink
- Report Inappropriate Content
What is the expected output here? What is wrong?
- Mark as New
- Bookmark
- Subscribe
- Mute
- Subscribe to RSS Feed
- Permalink
- Report Inappropriate Content
Please find the below Attachment and kindly Look in to Third Sheet
Thanks,
Muthu
- Mark as New
- Bookmark
- Subscribe
- Mute
- Subscribe to RSS Feed
- Permalink
- Report Inappropriate Content
I am unable to find a way to make this work.... may be you need to use overlapping charts? Not sure...
- « Previous Replies
-
- 1
- 2
- Next Replies »