Unlock a world of possibilities! Login now and discover the exclusive benefits awaiting you.
- Qlik Community
- :
- All Forums
- :
- QlikView App Dev
- :
- How to group and present the data into pie chart
- Subscribe to RSS Feed
- Mark Topic as New
- Mark Topic as Read
- Float this Topic for Current User
- Bookmark
- Subscribe
- Mute
- Printer Friendly Page
- Mark as New
- Bookmark
- Subscribe
- Mute
- Subscribe to RSS Feed
- Permalink
- Report Inappropriate Content
How to group and present the data into pie chart
Dear Sir,
I would like to be able to group data in a column to create a pie chart.
The source table gets 2 columns only - PO and required_date (i.e. required delivery date)
Following has been inserted in the script to calaulate the balance days for delivery.
Num(Date(request_date ,'DD-MM-YYYY'))-Num(today(),'DD-MM-YYYY') as M_Req_Bal_Day,
I want to group the M_Req_Bal_Day into 3, and present into pie chart format.
- < 0 (i.e. late delivery)
- >0 and <7 (i.e. goods should be delivery in coming 7 days)
- > 7 (i.e. goods will be delivery next week)
I think it is quite simole for someone with more experience but i am new in qlikview so guys any help would be very appreciated!!!
Thanks
Accepted Solutions
- Mark as New
- Bookmark
- Subscribe
- Mute
- Subscribe to RSS Feed
- Permalink
- Report Inappropriate Content
Hi,
Try removing the dimension from the Pie Chart. It would still give you the result and hopefully, meet your requirement.
Hope it helps.
Regards,
-Khaled.
- Mark as New
- Bookmark
- Subscribe
- Mute
- Subscribe to RSS Feed
- Permalink
- Report Inappropriate Content
Hi,
If you are counting the POs that are delivered late, in the coming days or in the next week, try using these expressions in the pie chart.
1. count({<M_Req_Bal_Day)={'<0'}>}PO)
2. count({<M_Req_Bal_Day)={'>0<7'}>}PO)
3. count({<M_Req_Bal_Day)={'>0'}>}PO)
Hope it helps.
Regards,
-Khaled.
- Mark as New
- Bookmark
- Subscribe
- Mute
- Subscribe to RSS Feed
- Permalink
- Report Inappropriate Content
Dear Khaled.
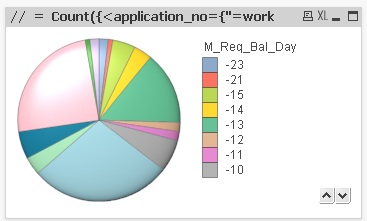
Thanks for your advice. However, the pie chart was displayed in following.
In the Pie Chart dimension - M_Req_Bal_Day is used.
In the Expression, your suggestion is applied. However, the result is not in 3 groups.
= Count({<M_Req_Bal_Day={"<0"}>} PO)
= Count({<M_Req_Bal_Day={">0<7"}>} PO)
= Count({<M_Req_Bal_Day={">7"}>} PO)
Highly appreciately if any further advice can be provided. Thanks much.

- Mark as New
- Bookmark
- Subscribe
- Mute
- Subscribe to RSS Feed
- Permalink
- Report Inappropriate Content
You will need to add a few columns. The first you will use to calculate the number of days between today and the required date. The second will be an if statement to create buckets based on the range you specified.
Here is how it would work.
- Mark as New
- Bookmark
- Subscribe
- Mute
- Subscribe to RSS Feed
- Permalink
- Report Inappropriate Content
Hi,
Try removing the dimension from the Pie Chart. It would still give you the result and hopefully, meet your requirement.
Hope it helps.
Regards,
-Khaled.
- Mark as New
- Bookmark
- Subscribe
- Mute
- Subscribe to RSS Feed
- Permalink
- Report Inappropriate Content
Try this dimension:
=
if(Days_To_Ship<=0, 'Late',
if(Days_To_Ship
>7,'Next Week',
'Coming 7 Days'))
Thanks !!