Unlock a world of possibilities! Login now and discover the exclusive benefits awaiting you.
- Qlik Community
- :
- All Forums
- :
- QlikView App Dev
- :
- How to group various date into week, month and yea...
- Subscribe to RSS Feed
- Mark Topic as New
- Mark Topic as Read
- Float this Topic for Current User
- Bookmark
- Subscribe
- Mute
- Printer Friendly Page
- Mark as New
- Bookmark
- Subscribe
- Mute
- Subscribe to RSS Feed
- Permalink
- Report Inappropriate Content
How to group various date into week, month and year?
Dear All,
I have a list of date that indicating various dates and i would like to group them into week, month and year to make the analysis in a broaden sense.
Following are part of the table i have:
Date of Purchase
13/5/2012
24/5/2012
24/5/2012
24/5/2012
28/5/2012
17/5/2012
17/5/2012
17/5/2012
17/5/2012
17/5/2012
17/5/2012
10/4/2012
10/4/2012
2/3/2012
Can i group them into week (i.e. 1st week May, 2nd week May, 3rd week May), month (Feb, Mar, Apr, May) and year (2011, 2012)
If yes, may i know how can i do this?
Thanks
Cyrus Low
- Mark as New
- Bookmark
- Subscribe
- Mute
- Subscribe to RSS Feed
- Permalink
- Report Inappropriate Content
Hi,
First of all, you need to change the date formatting to
SET DateFormat='D/M/YYYY';
Then try this piece of code.
tempTable:
LOAD * INLINE [
DateOfPurchase
13/5/2012
24/5/2012
24/5/2012
24/5/2012
28/5/2012
17/5/2012
17/5/2012
17/5/2012
17/5/2012
17/5/2012
17/5/2012
10/4/2012
10/4/2012
2/3/2012];
NoConcatenate
LOAD *,
Year(DateOfPurchase) as PurchaseYear,
Month(DateOfPurchase) as PurchaseMonth,
Week(DateOfPurchase) as PurchaseWeek
Resident tempTable;
Drop table tempTable;
Regards,
Xue Bin
- Mark as New
- Bookmark
- Subscribe
- Mute
- Subscribe to RSS Feed
- Permalink
- Report Inappropriate Content
Dear Xue Bin,
Thank you for your answer. As i am pretty new to Qlikview and have no programming background, i don't know where should i put the codes, could you please advice me?
I have tried putting it into the "Dimension" but reflects error.
Cheers
Cyrus
- Mark as New
- Bookmark
- Subscribe
- Mute
- Subscribe to RSS Feed
- Permalink
- Report Inappropriate Content
Hi Cyrus,
If you go File->Edit Script.. A script window will open. In the script window, you will see a line SET DateFormat=xxx; Change it to SET DateFormat='D/M/YYYY'; This changes the date formatting to fit your data. Then copy the rest of the script below all the given code in the script window. Click Reload in the top left corder. Now you have loaded your code into memory. You can now add all the fields loaded and do analysis according to Year, Month and Week. Since you are new to qlikview. I would recommend you to go through the qlikview tutorial first. You can download a copy free from http://www.qlik.com/us/services/training/free-training. Hope it helps.
Regards,
Xue Bin
- Mark as New
- Bookmark
- Subscribe
- Mute
- Subscribe to RSS Feed
- Permalink
- Report Inappropriate Content
Dear Xue Bin,
Thank you for your prompt reply and guidance.
I manage to key-in the codes and play around with the new dimension (i.e. purchaseweek, purchasemonth, purchaseyear).
However, my new chart does not seen to reflect the actual results.
My chart supposed to indicate my purchase ProductCategories (e.g. hand tools, power tools, safety, ) over total purchase quantity (Y Axis) and Purchase Date (X Axis).
Now the chart is showing me that i have purchase power tool across Mar-May, 1 unit each/per month, but the fact is that i have only purchase 1 unit on May, 0 in Feb and April. Kindly refer to attachment for your kind reference.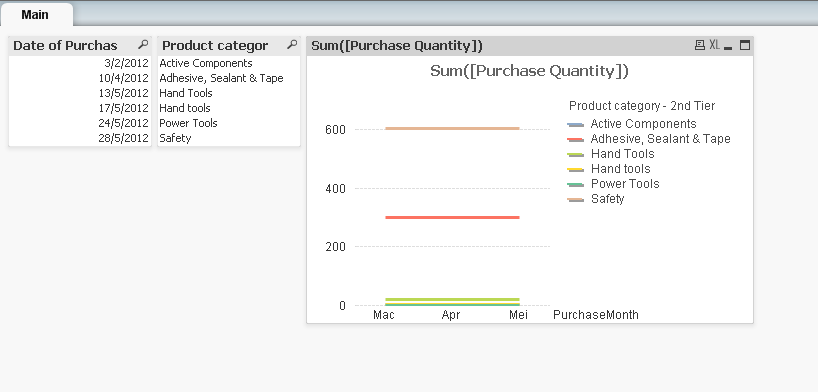
These error happens to all other ProductCategories, where the chart has sum up the quantity of each ProductCategories and assuming that the purchase is across Feb, Apr and May.
I wonder if some configuration need to be done on ProductCaegories or simply i have place the ProductCategories in wrong dimension?
Hope to get advice from you.
Thanks
Cyrus
- Mark as New
- Bookmark
- Subscribe
- Mute
- Subscribe to RSS Feed
- Permalink
- Report Inappropriate Content
Hi,
Can you post your code here and attach your qvw file below. I don't own a license but there are ppl here who can open it and debug for you.
Regards,
Xue Bin
- Mark as New
- Bookmark
- Subscribe
- Mute
- Subscribe to RSS Feed
- Permalink
- Report Inappropriate Content
Dear Xue Bin,
I dont own a license too.
I have re-attached my qvw file at 1st discussion.
Thanks
Cyrus