Unlock a world of possibilities! Login now and discover the exclusive benefits awaiting you.
- Qlik Community
- :
- All Forums
- :
- QlikView App Dev
- :
- How to include Aggr - chart function ‒ QlikView in...
- Subscribe to RSS Feed
- Mark Topic as New
- Mark Topic as Read
- Float this Topic for Current User
- Bookmark
- Subscribe
- Mute
- Printer Friendly Page
- Mark as New
- Bookmark
- Subscribe
- Mute
- Subscribe to RSS Feed
- Permalink
- Report Inappropriate Content
How to include Aggr - chart function ‒ QlikView in script instead?
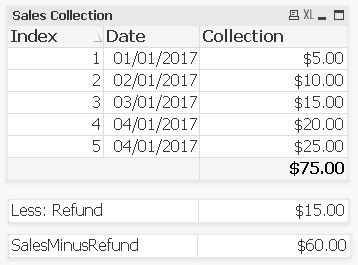
I have several measures using Aggr functions in different tables. I wish to insert them into rows of a table to have them all in ONE table.I was wondering if this could be done in the script.

In the pictures are 3 Straight Tables that I wish to combine into one table. In terms of rows (including the first table's TOTAL row) and column they should follow the picture.
Table 1
Dim1 : Index
Dim2 : Date
Mea: Sum(Sales)
Table 2
Dim1 : 'LessRefund'
Mea: Sum(aggr(Sum (Refund),Date))
Table 3
Dim1: 'SalesMinusRefund'
Mea: Sum(aggr(Sum (Sales),Date)) - Sum(aggr(Sum (Refund),Date))
I have attached the QVW. Appreciate any assistance.
- Tags:
- qlikview script
- Mark as New
- Bookmark
- Subscribe
- Mute
- Subscribe to RSS Feed
- Permalink
- Report Inappropriate Content
May be like in attached qvw?
- Mark as New
- Bookmark
- Subscribe
- Mute
- Subscribe to RSS Feed
- Permalink
- Report Inappropriate Content
Hi Tresesco,
Thanks for the quick reply!
- How do you have dual() show 'LessRefund' in the straight table? !
- Hmm, even though your solution works. overall it still does not work for me because I have a master calendar linking the date fields together. When dates are selected, those dual() fields are filtered out. (Sorry I should have gave my whole scenario!)
@ !
- Mark as New
- Bookmark
- Subscribe
- Mute
- Subscribe to RSS Feed
- Permalink
- Report Inappropriate Content
If I understand your inquiry correctly, you are looking for a way to dynamically create custom totals at the bottom of the straight table. Have you looked at the other custom totals solution in community for reference on the best approach in your case?
I am a bit unclear on why you need the custom values in your data model. Shouldn't the primary aim be to have the chart contain the custom values?
For best possible replies in the community I would suggest that you try to be as clear as possible and exemplify the expect result. For example in this case use Excel or inline data to help you visualise what result you expect under defined selections.
Keep in mind that this is a community and not free consulting, so you might not get the exact implementation for your needs but rather suggestions possible techniques on how to approach your issue.