Unlock a world of possibilities! Login now and discover the exclusive benefits awaiting you.
- Qlik Community
- :
- All Forums
- :
- QlikView App Dev
- :
- How to make a chart of parcial sums
Options
- Subscribe to RSS Feed
- Mark Topic as New
- Mark Topic as Read
- Float this Topic for Current User
- Bookmark
- Subscribe
- Mute
- Printer Friendly Page
Turn on suggestions
Auto-suggest helps you quickly narrow down your search results by suggesting possible matches as you type.
Showing results for
Not applicable
2013-02-09
06:19 PM
- Mark as New
- Bookmark
- Subscribe
- Mute
- Subscribe to RSS Feed
- Permalink
- Report Inappropriate Content
How to make a chart of parcial sums
Hello,
i have a table like this...
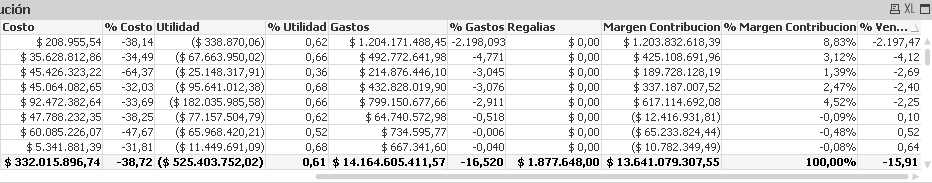
and i want to make a bar chart for the parcial sum for example, (0,61 of % utilidad) or (-16,25 of % Gastos),
they are long expresions from diferent fields so i cant do just "sum (total field)"
how can i make this?
thanks....
412 Views
1 Reply
Not applicable
2013-02-11
02:45 AM
Author
- Mark as New
- Bookmark
- Subscribe
- Mute
- Subscribe to RSS Feed
- Permalink
- Report Inappropriate Content
as i understand what you want to achieve....
- copy that Table(chart)
- remove all dimensions
- change type from straight table to bar chart
285 Views